News — 06 May, 2024
Our End-to-End Mapping Solution: Mapping exercise at CliGeos Summer School
In April 2024, we had the opportunity to demonstrate the power of open mapping tools and workflows at the CLImbing for CLImate GEOspatial School (CLIGEOS-2024) in Annapurna-3, Lumle-Pokhara, Nepal.
This summer school was jointly organized by the Center for Space Science and Geomatics Studies (CSSGS) at Tribhuvan University, the University of Udine in Italy, and LJ University in India The primary goal was to train participants from diverse backgrounds, including students, geospatial professionals, and government representatives, on conducting an end-to-end mapping exercise using open-source software. We aimed to showcase how these tools can support decisions around climate change challenges. With the help of the organizing team and more than 30 participants, we were able to carry out the entire end-to-end mapping workflow.
“With the help of the organizing team and more than 30 participants, we were able to carry out the entire end-to-end mapping workflow.”
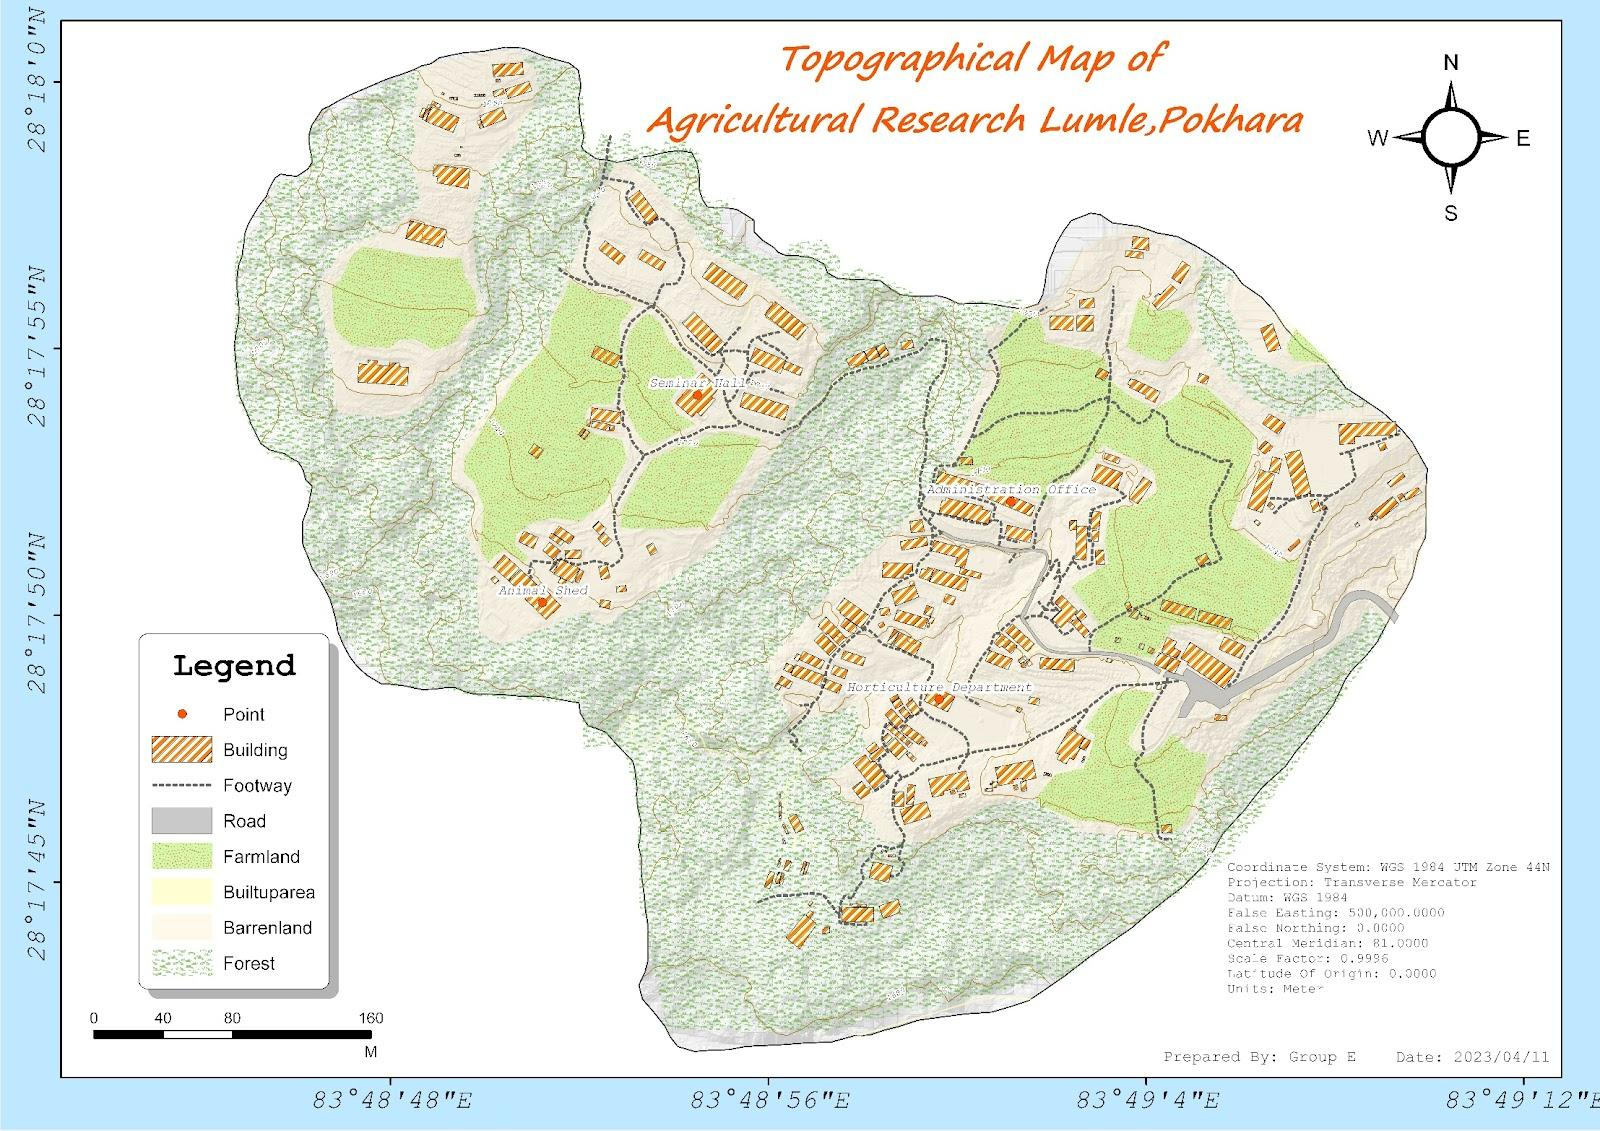
Area of Interest
The area for our exercise was the beautiful, diverse perimeter of the Agriculture Research Center, located approximately 20 km northwest of Pokhara. This area, outlined on OpenStreetMap (OSM/way/742793744), is situated in Lumle, a town in the Annapurna Rural Municipality, Kaski District, in the Gandaki Zone of northern-central Nepal. Lumle is known for being the highest rainfall area in Nepal and relies on its hilly terrain with beautiful views.
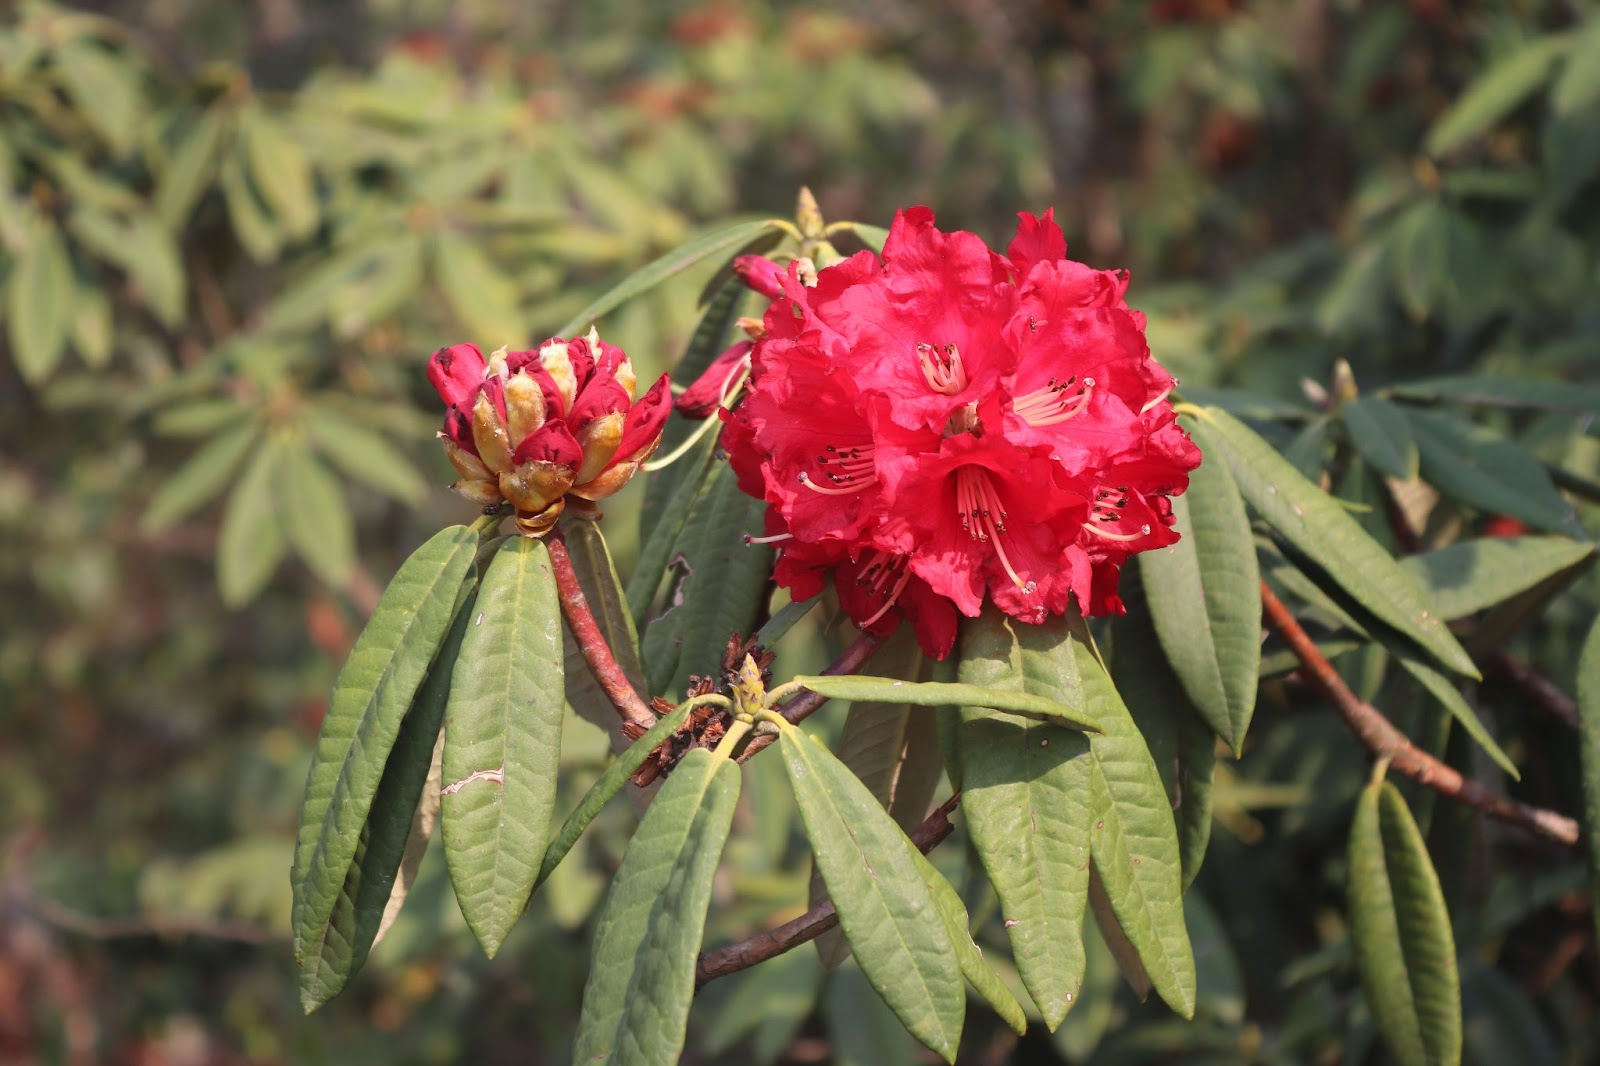
Left: National flower Rhododendron - Photographer Beneesh Shrestha
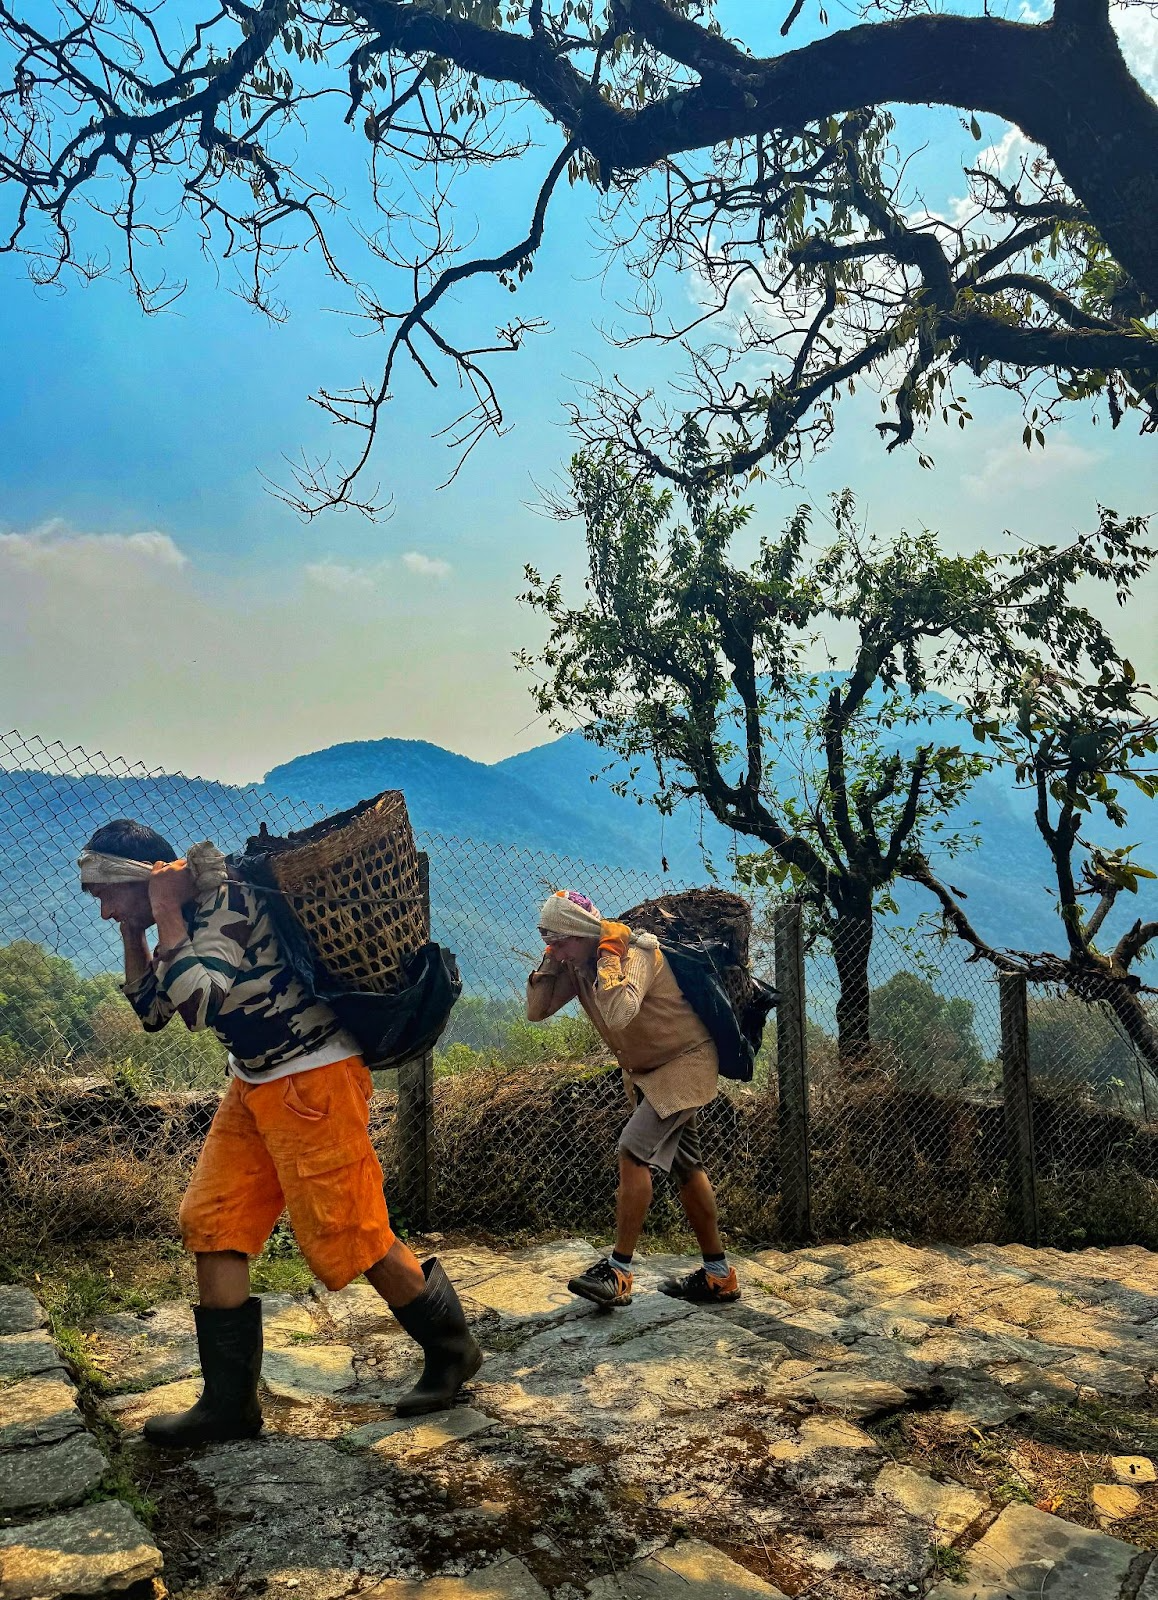
Right: Farmers carrying organic manure to field seen during our field exercise
photo by Ritika Sunar
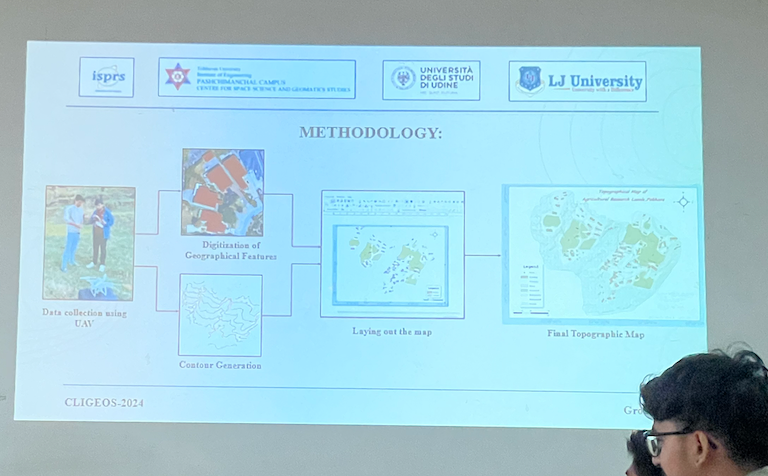
Step-by-Step Approach
STEP 1 - Acquire base & sensor data
- OpenDroneMap (ODM): website
- HOT OpenAerialMap (OAM):Product Page - website - docs
Drone Data Collection: We flew a Phantom 4 RTK Multispectral drone over the testing area to collect recent, high-resolution aerial imagery. The drone’s multispectral capabilities allowed us to capture data across multiple spectral bands, including the Near-Infrared (NIR) band, which is useful for vegetation analysis.
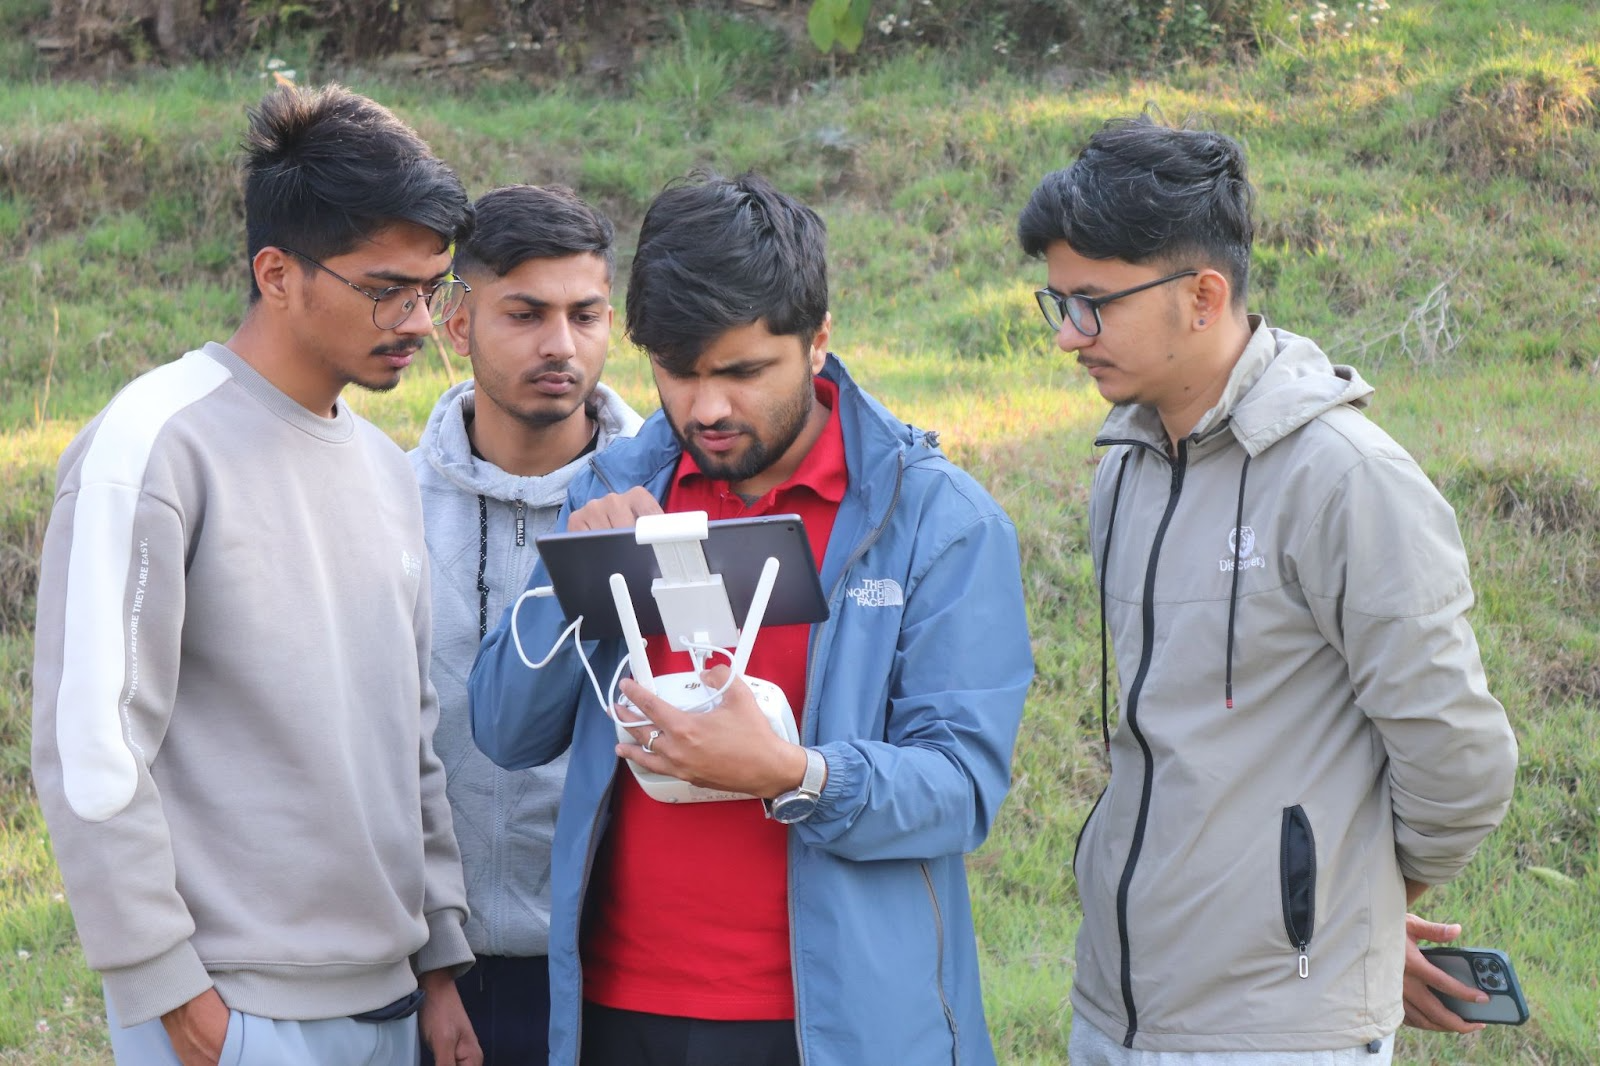
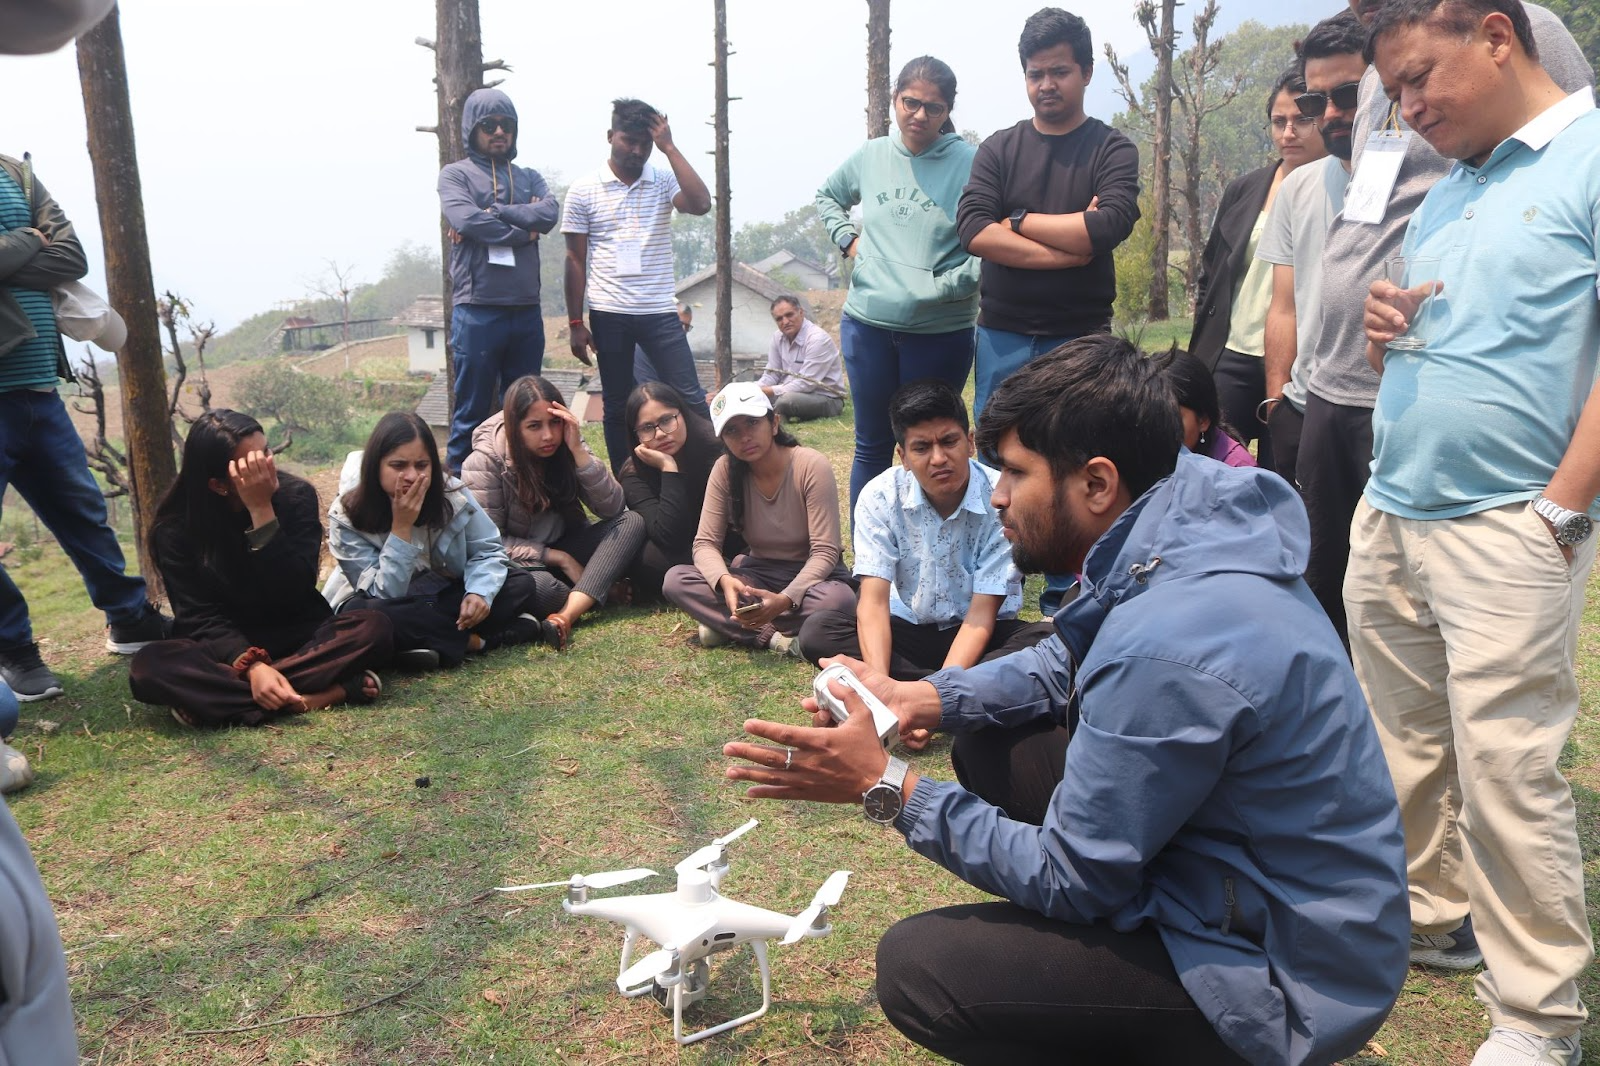
A HOT Staff member, Kshitij demonstrating how drone work and how to capture imagery.
Drone Data Processing: The raw drone imagery was processed using OpenDroneMap (ODM), an open-source photogrammetry toolkit. ODM allowed us to generate valuable data products from the imagery, such as Digital Surface Models (DSMs) representing the elevation of objects and surfaces, Digital Terrain Models (DTMs) representing the bare earth terrain, a six-band orthophoto with visible and NIR bands, and indices like the Normalized Difference Vegetation Index (NDVI).
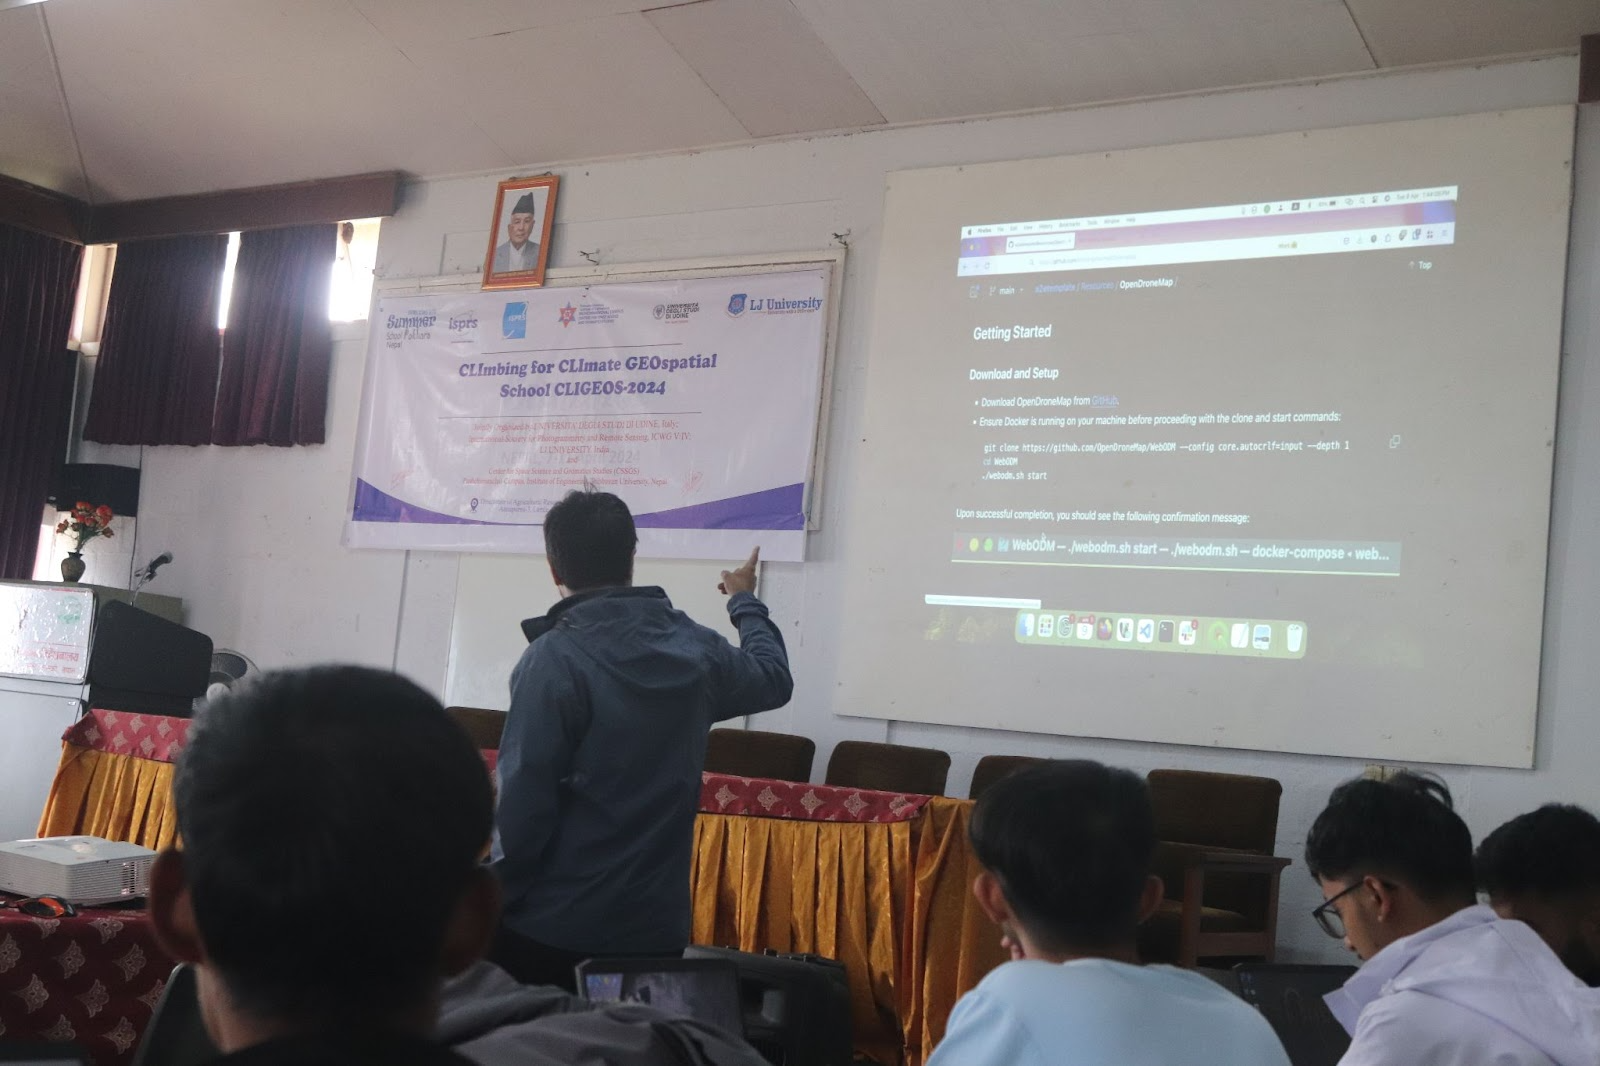
Walking through the steps and instructions to process drone image and upload
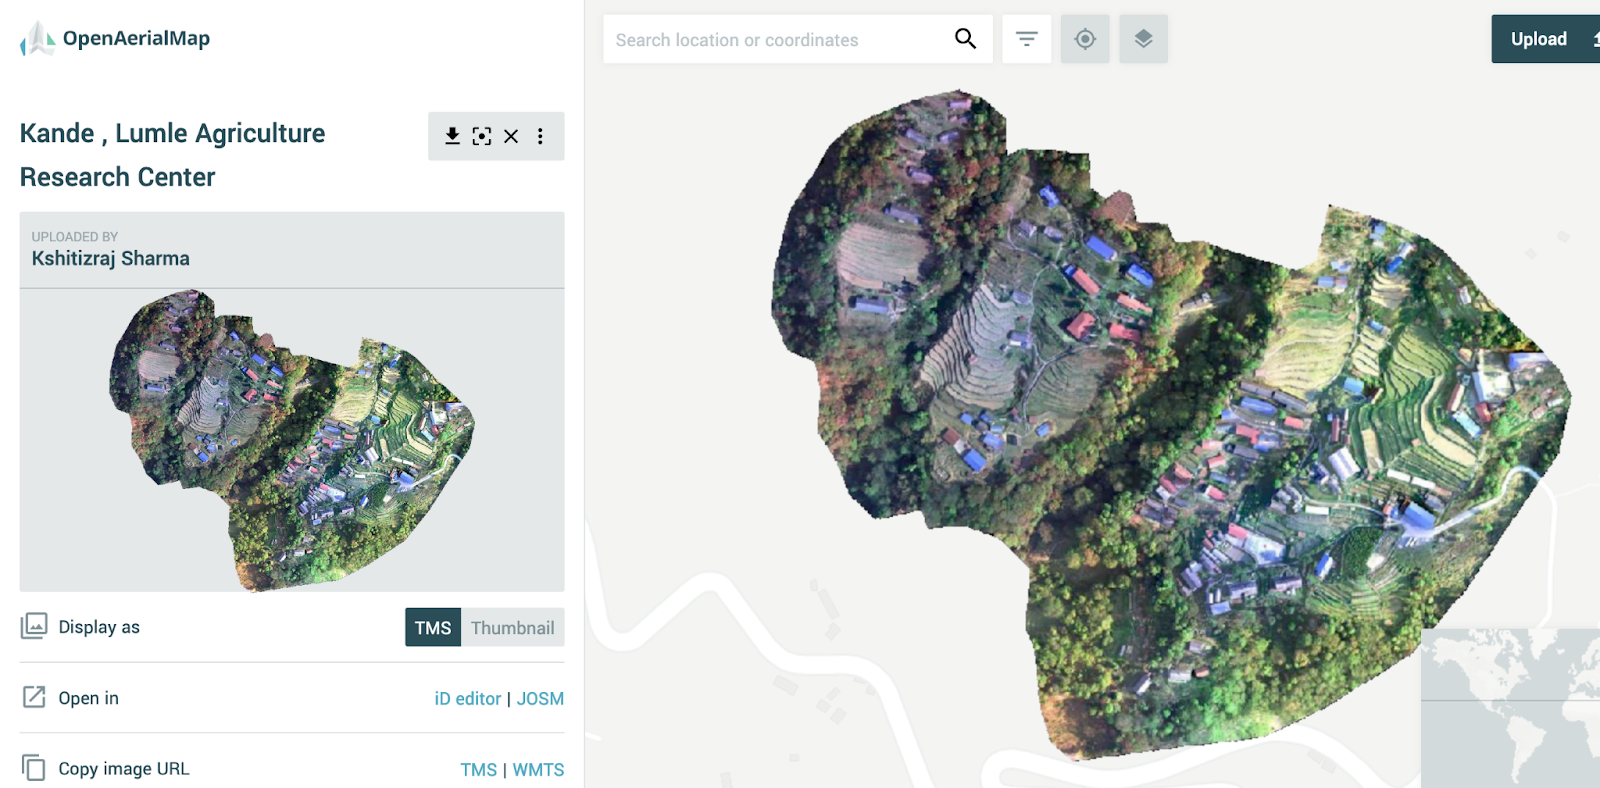
OpenAerialMap Upload: The processed orthophoto was uploaded to OpenAerialMap, an open repository for aerial imagery. Uploading the data to OpenAerialMap makes it accessible with the broader community, including everyone at the school.
STEP 2 - Process based & sensor data
- HOT Tasking Manager (TM): Product Page - website - docs
- HOT fAIr: Product Page - website - docs
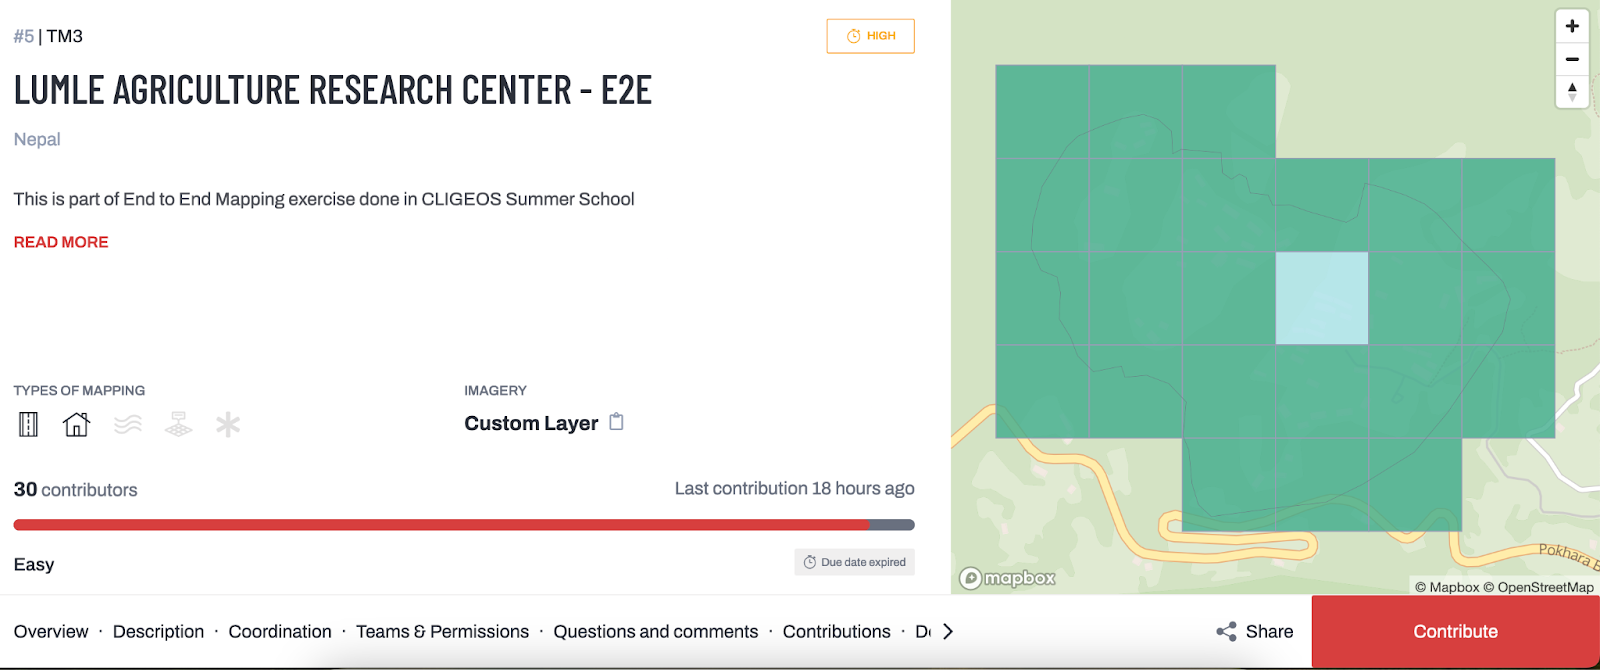
Tasking Manager Project: Using the orthophoto hosted on OpenAerialMap, we created a project on the HOT Tasking Manager dev server link. The Tasking Manager is a collaborative mapping tool that divides an area into smaller tasks, enabling distributed mapping by multiple participants.
Remote Mapping and Validation: A total of 30 participants contributed to remotely mapping the testing area by tracing building footprints, roads, and other features visible in the orthophoto. Participants also validated each other’s work to ensure accuracy and completeness of the data..
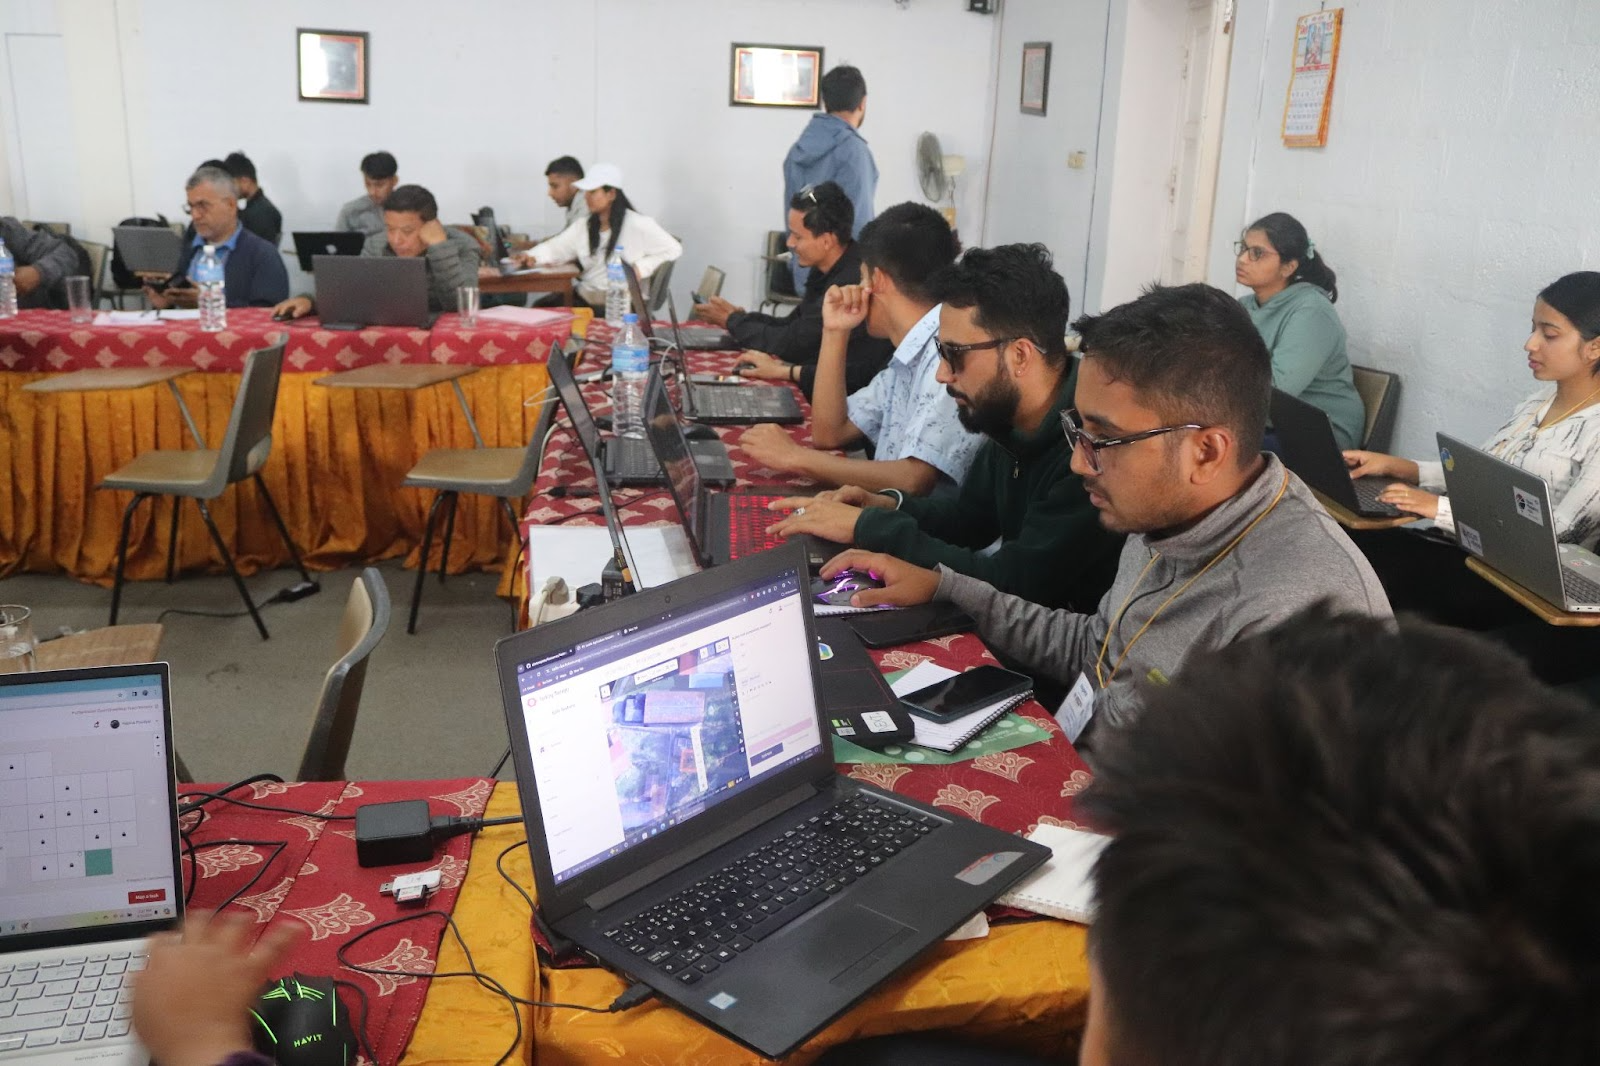
Participants doing remote mapping using Tasking Manager
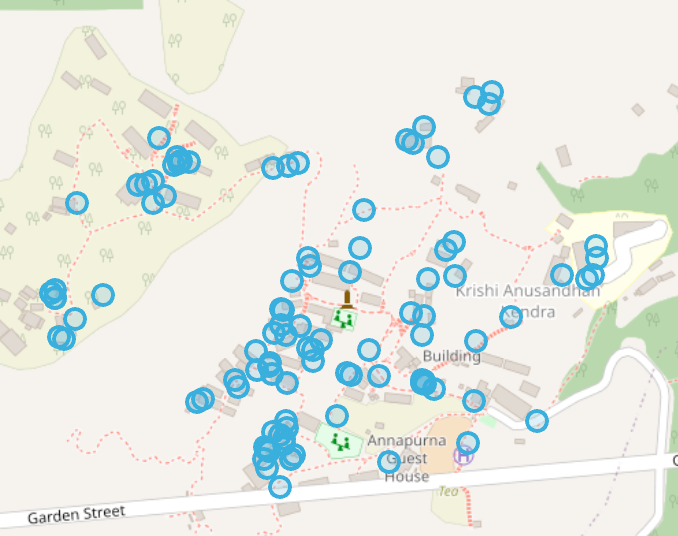
Local AI Model Creation: Using the manually traced remote mapping data as training data as input for AI modeling,, we created a local AI model link specific to our testing area. This model can be used for AI-assisted mapping tasks in similar contexts, potentially accelerating the mapping process, allowing to map in an AI-assisted way, in which the AI generates the new features which can then we validated by humans..
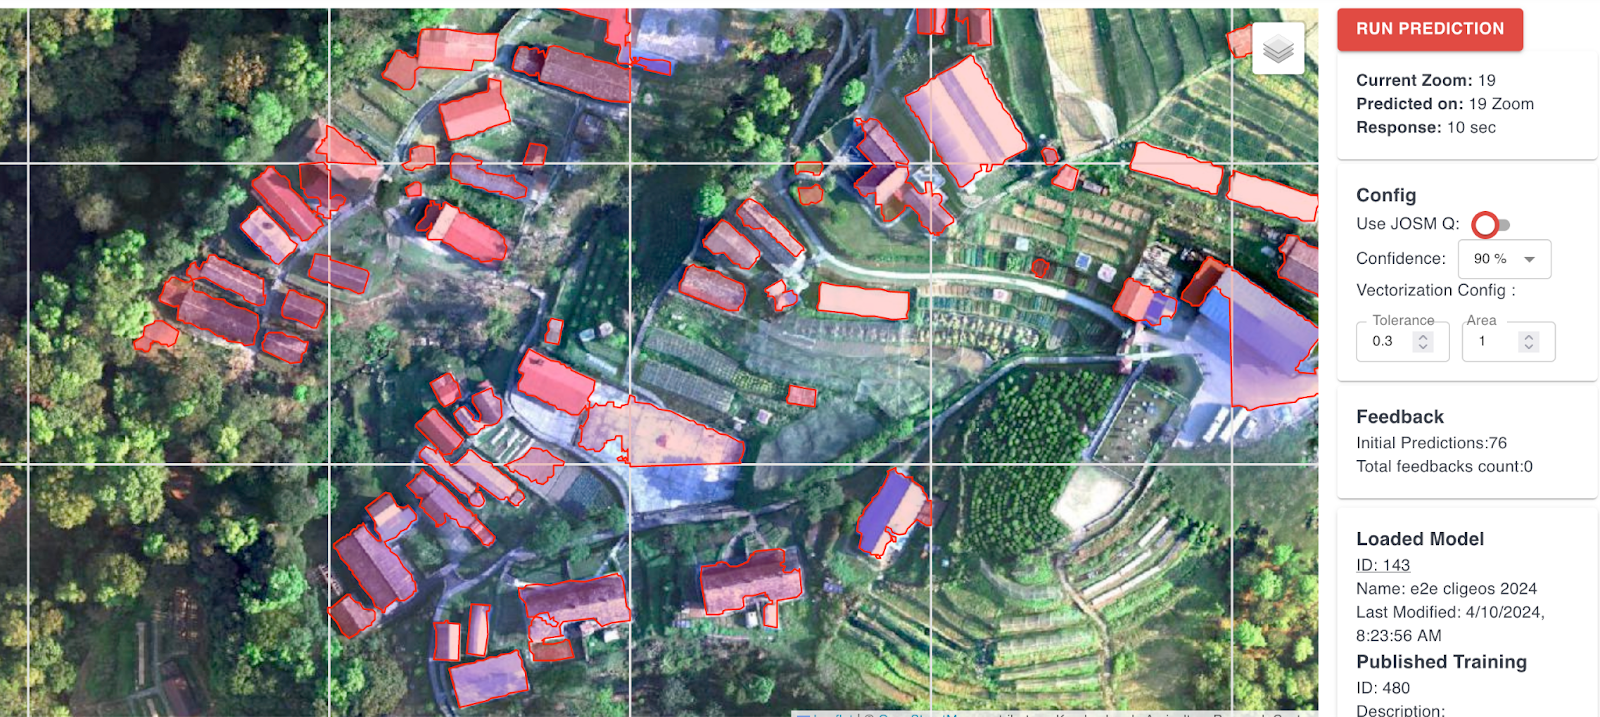
Localized AI Model created for the area
and how to capture imagery.
STEP 3 - Add local knowledge to the data
- HOT Field Mapping Tasking Manager (FMTM): Product Page - website - docs
- ODK Collect: website
Field Mapping Tasking Manager: To incorporate local knowledge and ground-level details, we established a Field Mapping Tasking Manager project link. This tool allows for the creation of custom data collection forms and divides the area into tasks for field mapping.
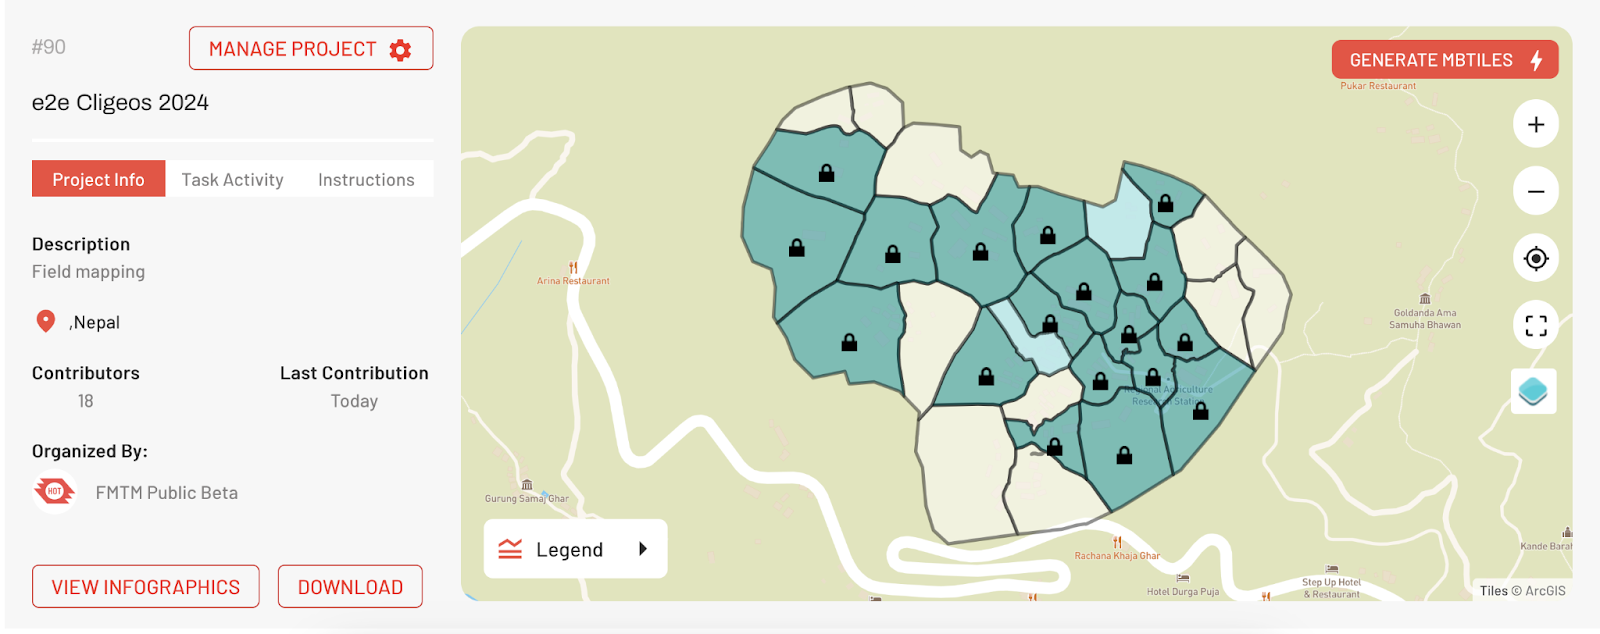
Participant locking tasks before heading towards field mapping
Data Collection in the Field: Participants used mobile devices with the ODK Collect app to conduct field mapping within the testing area. They collected additional data points and attributes based on a custom survey form, such as building materials, vulnerability to erosion, and the number of people residing in each building. This local knowledge complemented the remote mapping data.
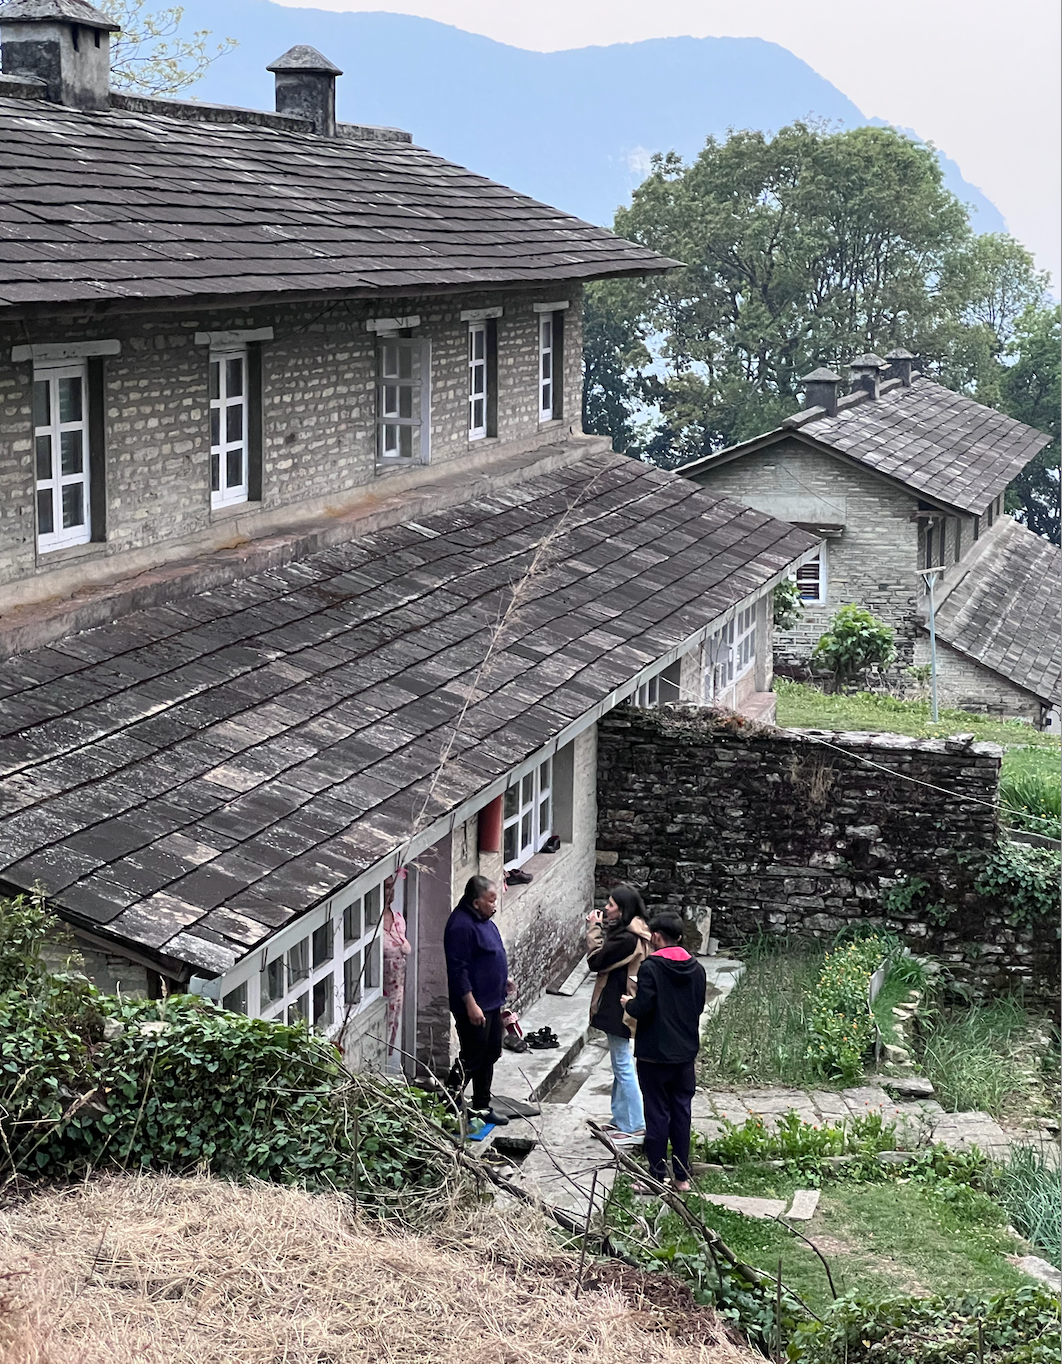
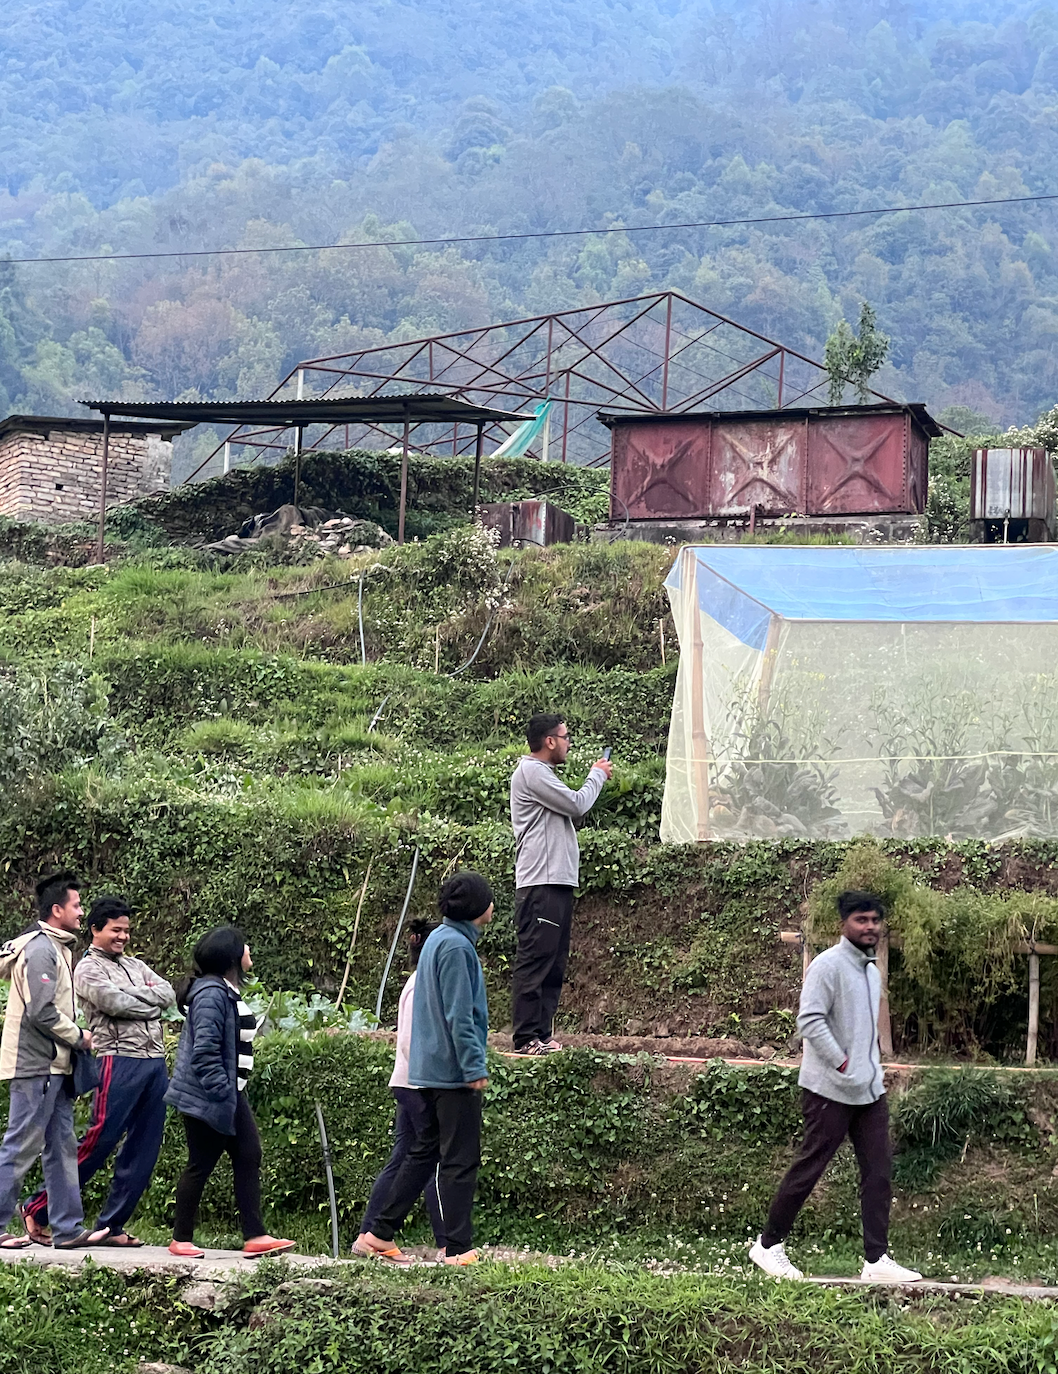
Participants collecting field data using FMTM, Asking house owners for the information
STEP 4 - Make map data accessible
- HOT Export Tool: Product Page - website - docs
Data Download (OSM Export Tool): To consolidate and access the mapping data, we used the OSM Export Tool link to download the OpenStreetMap data for the project area.
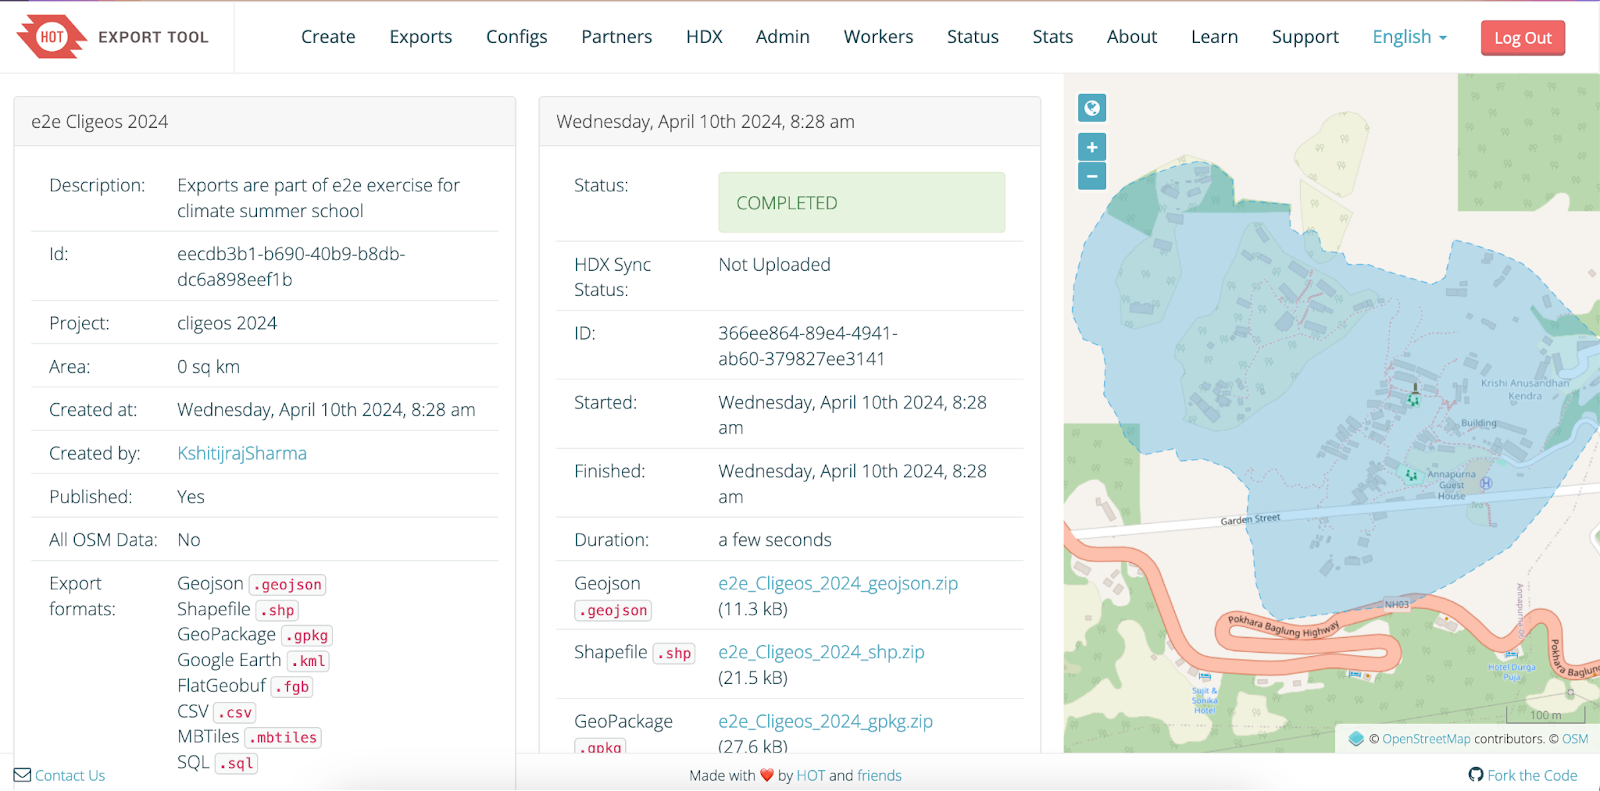
Export of the area of Interest
STEP 5 - Analyze map data for impact
- QGIS: website
QGIS Visualization and Analysis: Participants loaded the downloaded remotely mapped data, field mapped data, and data collected from aerial surveys into QGIS, an open-source geographic information system (GIS) software. Within QGIS, they visualized and analyzed the data, including creating 3D visualizations of the buildings and visualizing plant health. Not all data collected from the field necessarily needed to be uploaded to OpenStreetMap. Therefore, participants performed data cleaning and processing within QGIS itself. They downloaded the Field Mapping Tasking Manager (FMTM) data as a GeoJSON file directly from the FMTM services for further analysis and integration with other datasets.
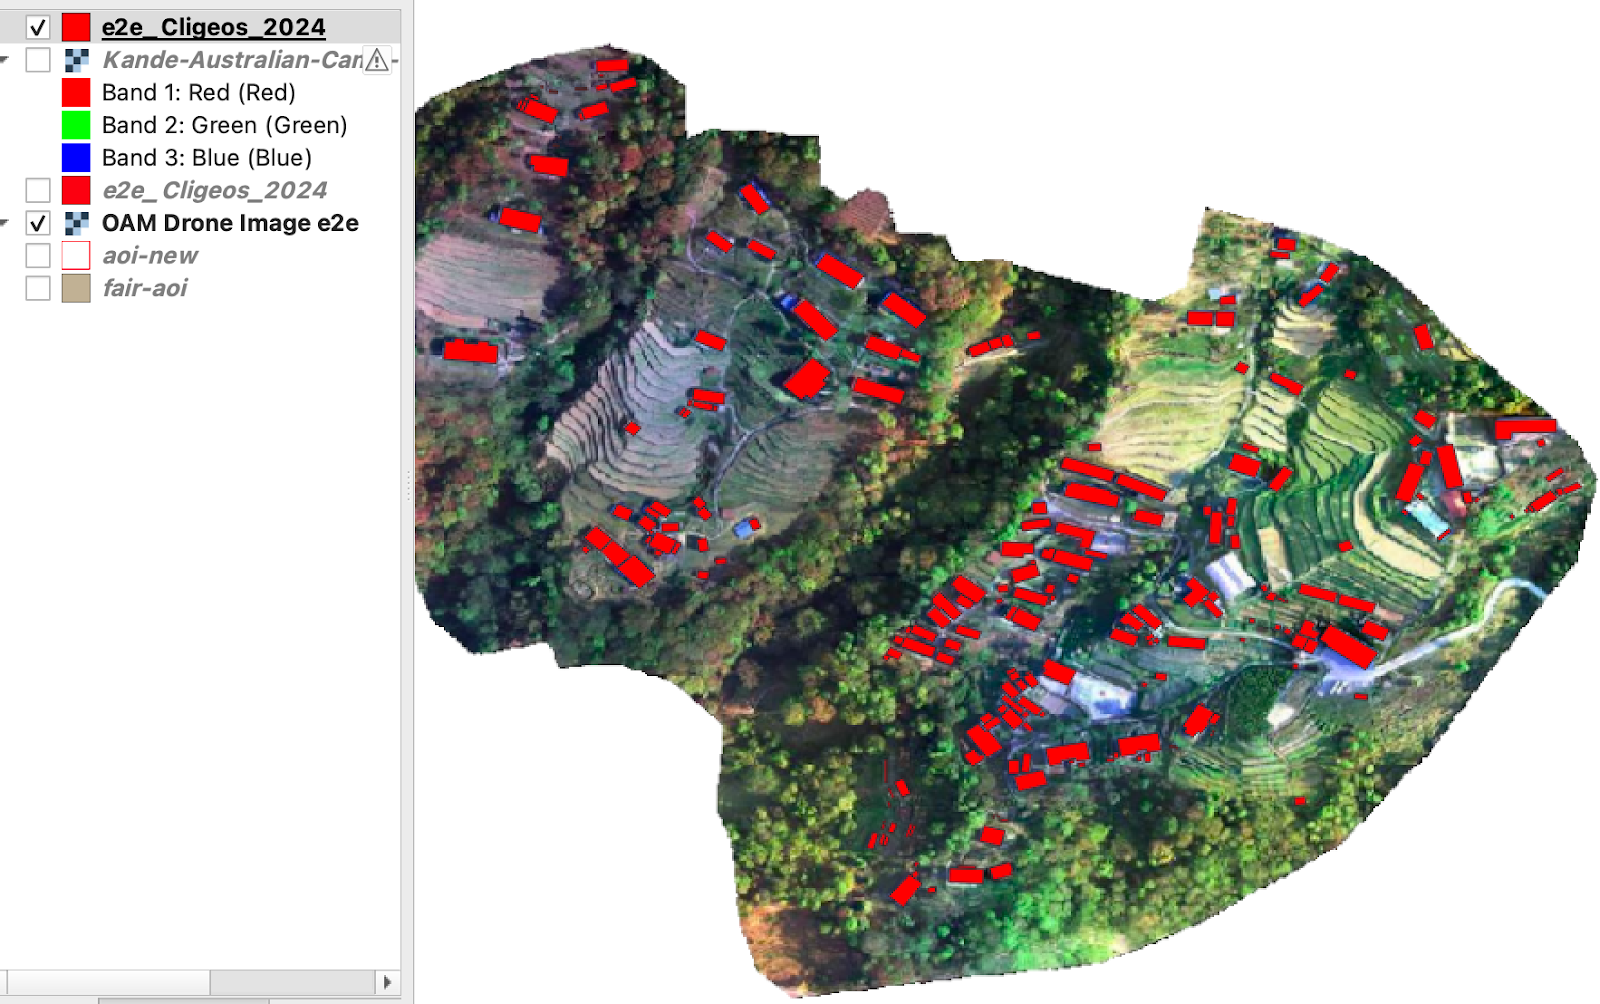
Left: Visualization of remotely mapped data and drone data
Right: Data collected from the field
Group Projects: The participants were divided into groups to work on specific projects utilizing the generated data. These projects focused on identifying vulnerable areas, assessing disaster risk, and exploring the potential impact of climate change on the local community.
One of the group presenting their work based on the data collected
Throughout the exercise, participants actively engaged in hands-on activities, ranging from drone operation and data collection to remote and field mapping, data processing, and analysis using open-source tools like QGIS.
Conclusion
This end-to-end mapping exercise at CLIGEOS-2024 demonstrated the effectiveness of using free and open-source tools in a collaborative environment to conduct comprehensive mapping activities. Within a short time frame and at a low cost, we were able to generate valuable geospatial data, including orthophotos, digital surface models, vegetation indices, local AI models, and both remote and field mapping data. The collaborative nature of tools like the HOT Tasking Manager , Field Mapping Tasking Manager and Local Model predictions from fAIr enabled efficient task allocation and resource utilization, maximizing the collective efforts of the participants.
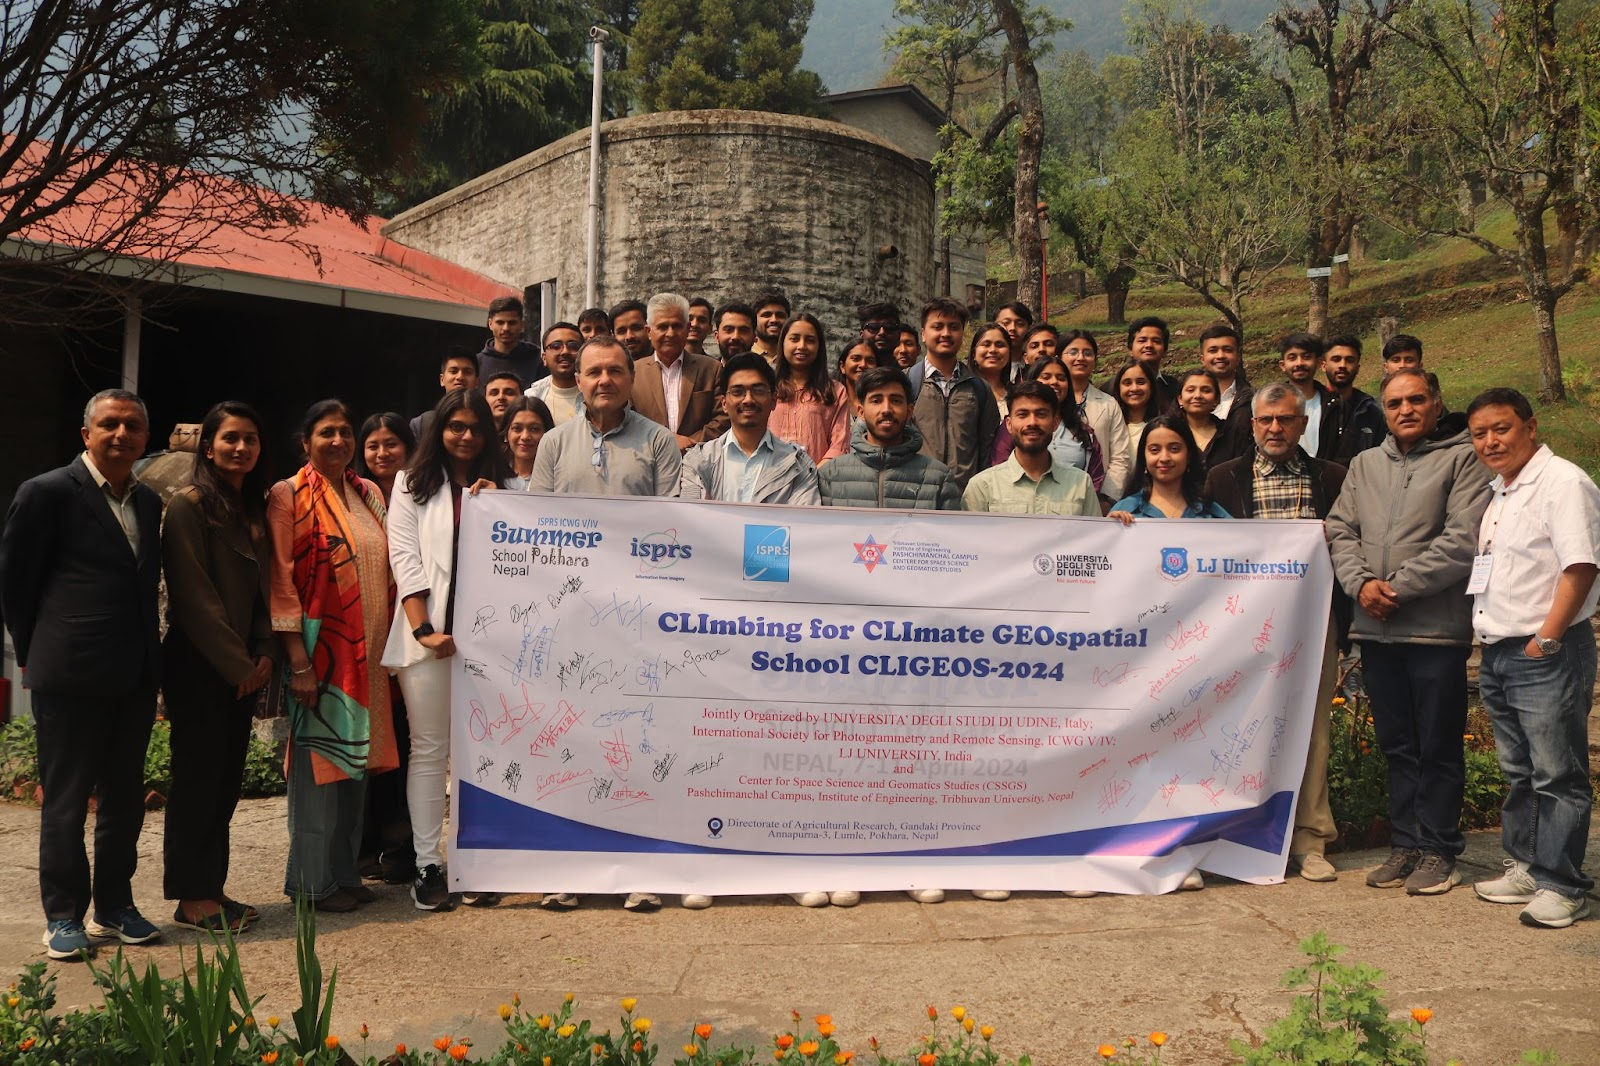
Team and Participants of Summer School
The success of this exercise highlights the potential of open mapping workflows to support climate change objectives, community resilience, and sustainable development initiatives.
“By empowering local communities with accessible tools and knowledge, we can foster data-driven decision-making and improve preparedness for environmental challenges. “
We are thankful for the organizers and the International Society for Photogrammetry and Remote Sensing (ISPRS), for giving us this opportunity to perform the entire activity, and we look forward to many more such opportunities in the future. I would also like to thank members of OSGeo Nepal for helping us troubleshoot technical problems during the activity and the energy and commitment of all participants truly made this a successful and rewarding experience.
🌟 Kshitij Raj Sharma 🌟