Ramani Huria: Building Open Tools to Map Drains
Posted by Innocent Maholi • Nov. 5, 2017

Ramani Huria's goal is resilience: to reduce the human impact of flooding. The most obvious way to do this is to reduce the likelihood of floods! Drainage is one of the ways to do so.

The drainage system in Dar es Salaam is enormous and complex, with hundreds of thousands of drains, often alongside roads, ranging from enormous 3-meter-deep concrete channels along highways to 5-cm-deep hand-dug ditches draining individual home sites. To help reduce flooding, we can map the drains and analyze them in specialized hydrological modelling software. This can allow us to identify problem spots that may need repair, redesign, or even simply cleaning by community members. In order to analyze the drains, we need more than just lines on the map; we need the profile (shape), dimensions, depth, material type, and surface roughness of the drains. Furthermore, the hydrological modelling software requires that every single segment of the drain map be connected; nothing can be missed or inaccurately positioned.
This type of mapping has traditionally been the preserve of highly-trained expert surveyors using expensive equipment. However, Ramani Huria sees an opportunity to work with highly skilled students from Ardhi University with community members with in-depth knowledge of their own neighbourhoods. This combination has resulted in data collection at an unprecedented scale, looking at the most flood-prone areas of Dar es Salaam.
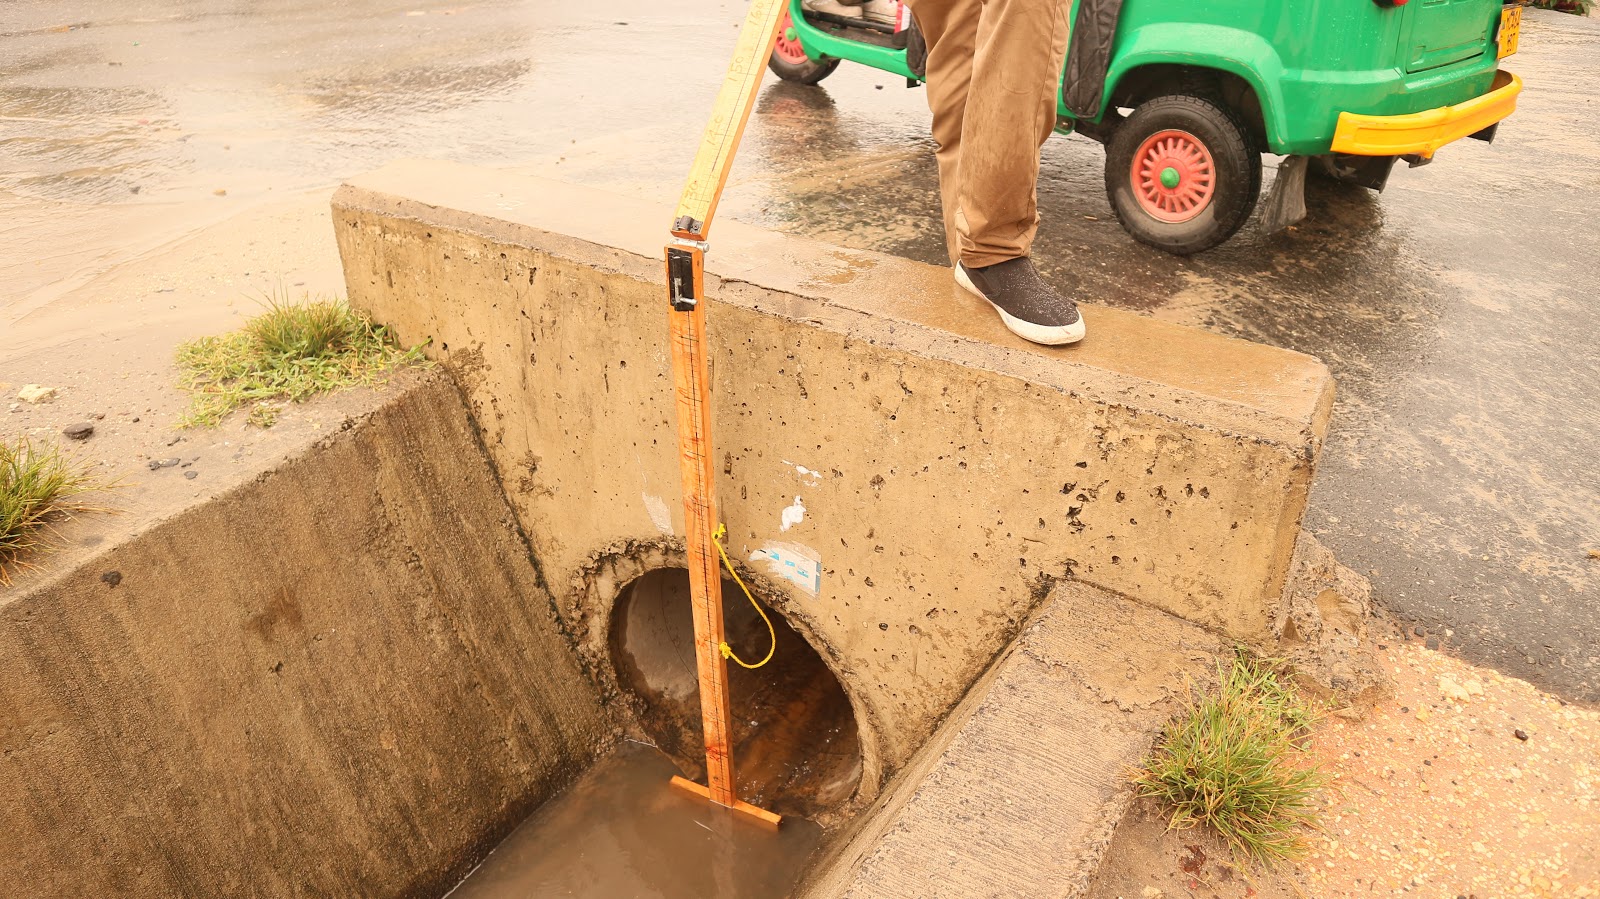
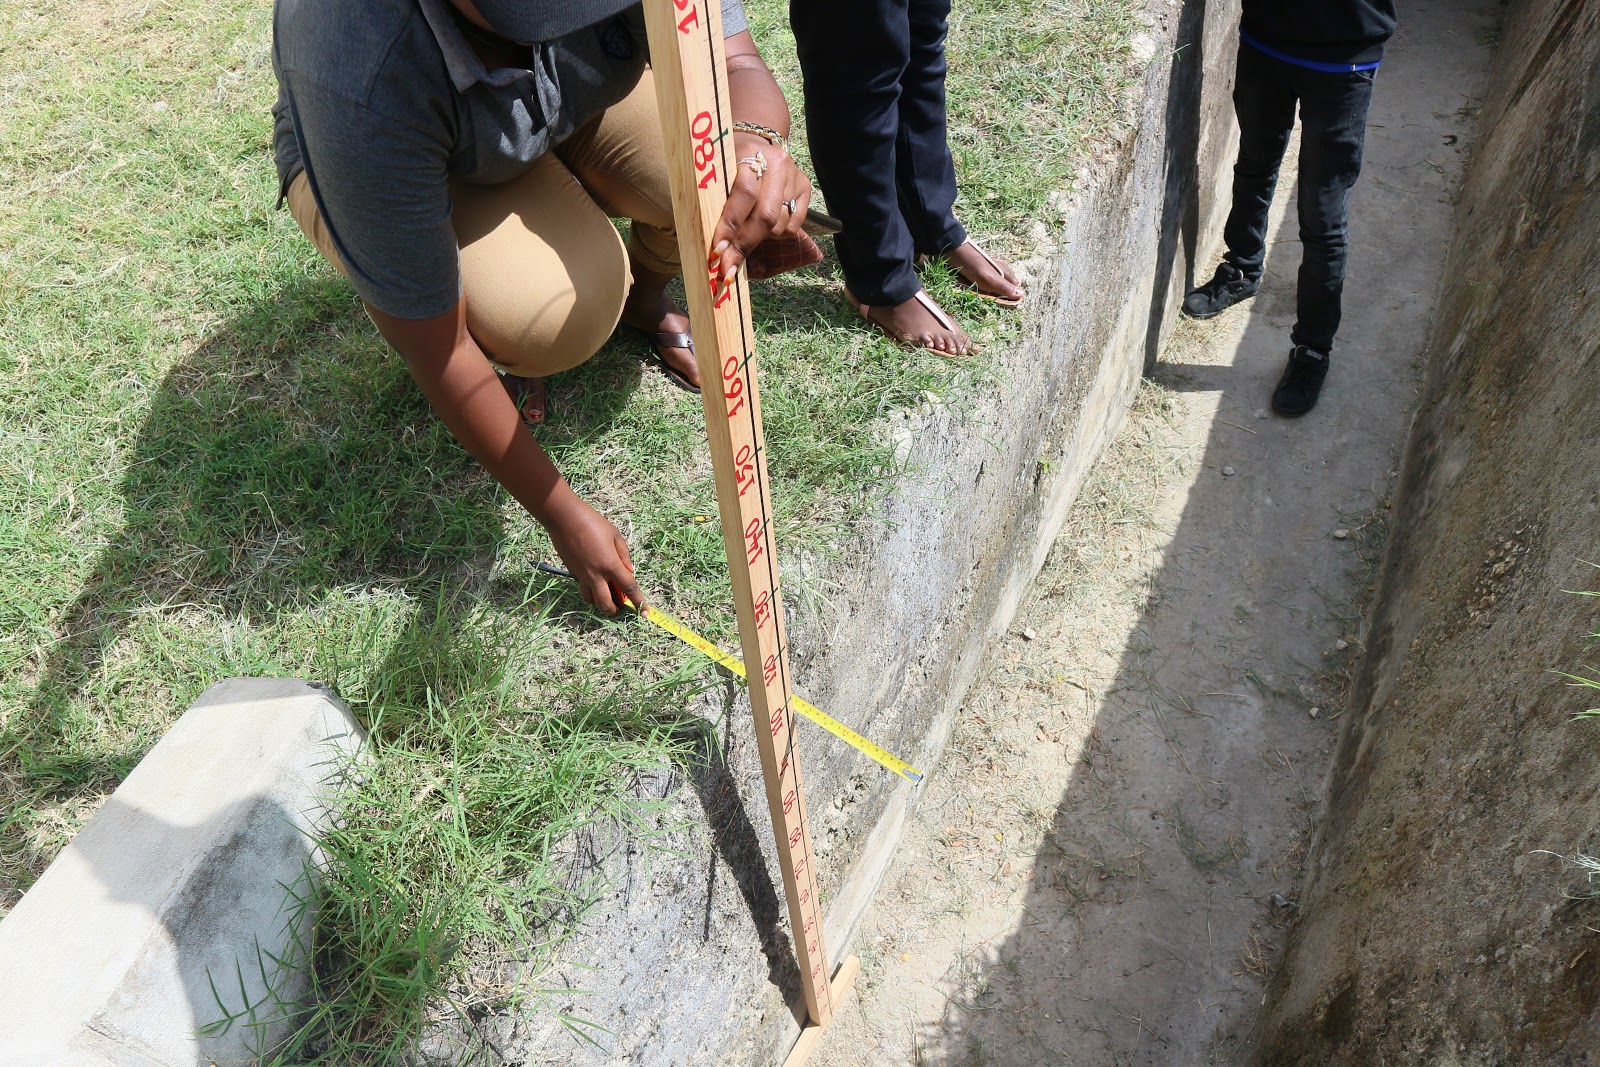
We first designed and built measuring sticks to effectively get the dimensions of the drains (ideally without spending a lot of time inside them), and purchases measuring tapes. However, though our smartphones have onboard GPS receivers, we were not aware of a software solution allowing us to capture lines as accurately as possible, as well as recording the various measurements and observations in a structured fashion.
The software we were able to find fell into two broad categories;
-
Programs specialized in recording GPS line traces, and
-
Programs specialized in data entry.
We couldn't find anything that did both well. Several Android software solutions allow the user to record relatively high-quality GPS line traces (obviously within the limits of the device's GPS accuracy), including an underlying map to see where one is, the ability to back up if the line loses accuracy partway through, and the ability to filter out points not meeting specified accuracy criteria.
![Screenshot_2017-11-01-11-46-14[1].png](https://cdn.hotosm.org/website/Screenshot_2017-11-01-11-46-14%5B1%5D.png)
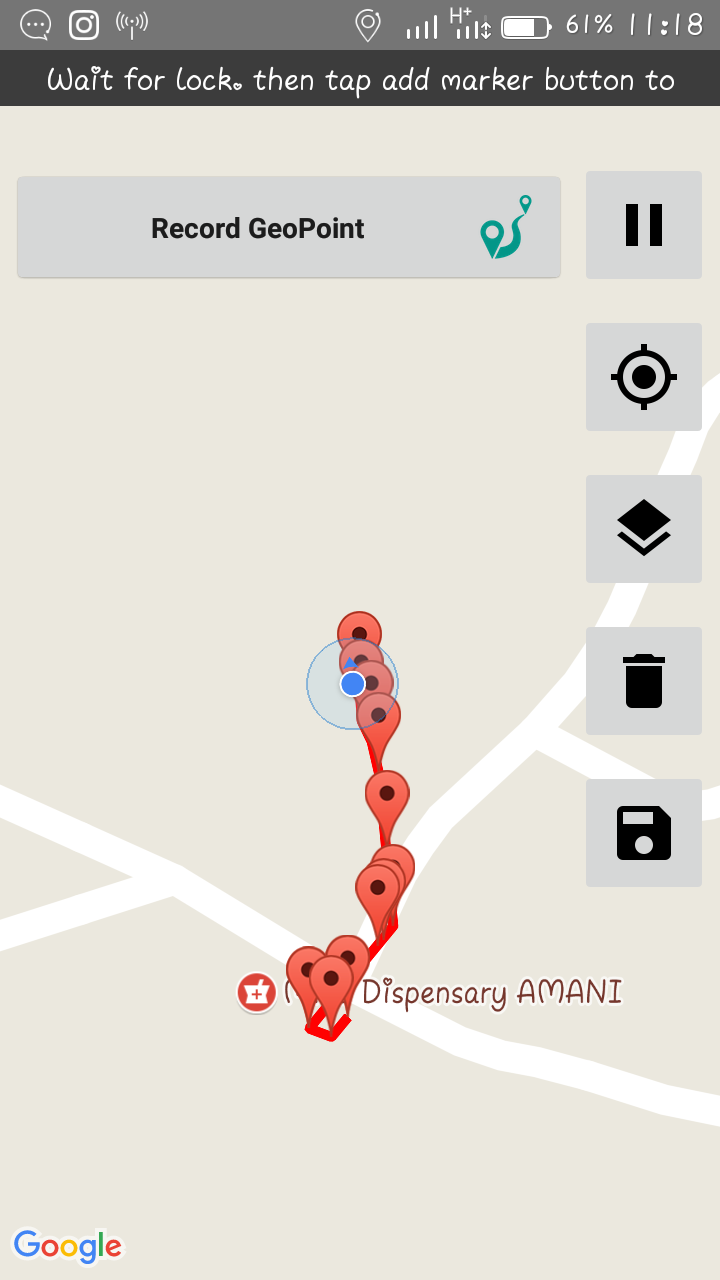
Several other programs, notably OpenDataKit (ODK) that we use extensively when mapping single-point features, allow the user to fill out form fields with specific types. ODK forms can accommodate numbers (integer or decimal), strings of text, selections from lists (single choice or "radio button" style, or multiple choice for selecting all that apply), and even photos from the smartphone's camera. However, ODK's feature for taking a GPS line, as opposed to a single point, was terribly inadequate. Whenever the GPS couldn't find satellites, the ODK would drop back to using network location (calculated from the strength of nearby cell towers), which is usually off by hundreds or even thousands of meters (this resulted in lines punctuated with enormous jumps to random locations, which were unusable for map-making). Other problems included an inability to select the necessary accuracy threshold, no way to delete only the last few points (whenever anything went wrong you'd have to start again), no way to zoom in far enough to verify one's position, and an output format that lacked both elevation and precision data (both available from the onboard GPS receiver on the phones).
Our choices were:
-
Use a map software such as the very high-quality free and open OSMAnd, and record all of the data in a single "comment" field. This would require enormous training and supervision to ensure that all of the complex drain data was recorded in a consistent fashion.
-
Use a data entry software such as ODK with poor line capabilities, and put up with the limitations. This would result in the surveyors spending much more time taking each line due to forced restarts, and would result in poor overall line precision.
-
Use one program to record the lines, and another to input the data. This would require very careful record-keeping to ensure that the data got attached to the right lines. Any time the indexes between the data and the lines got out of order, the entire dataset would be rendered useless and need to be re-done (potentially days or weeks of work).
-
Make a map software better at data entry, or a data entry software better at line mapping!
Enter Ka-Ping Yee, an extraordinarily capable software engineer with a keen interest in humanitarian work. Ping was vacationing in Europe when we called him to ask for help, and he agreed to spend a few weeks in Dar es Salaam volunteering his time with Ramani Huria.
We wanted our work to help everyone in the humanitarian mapping world, and therefore strongly preferred to use free/open source software(FOSS). We quickly settled on the strategy of adding better line-capturing capabilities to the free software OpenDataKit. ODK has for years been a towering colossus amongst Digital Humanitarian projects, largely due to the brilliance and commitment of the community of volunteer developers that maintains the app. We knew that if we added functionality to ODK, not only would Ramani Huria benefit, but the entire humanitarian sector would have access to our improvements.
Contributing to free/open source software is more complicated than it sounds! Before making changes to a project, it's essential to reach out to the community that created and maintains the software. If this is not done, it's very easy to duplicate work already being done, or even to make changes that are incompatible with or break other parts of the software. For that matter, sometimes open source developers have quite a strong emotional attachment to their projects, and can be defensive when someone tries to mess with the baby they've given so much love, time, and attention to, particularly if the newcomers crash in without introducing themselves and showing a little humility. Additionally, changes to software should never be made all at once, but rather introducing each change in isolation, including clear documentation, to allow for testing and review to make sure it doesn't break things. Our planning for Ping's code improvements spanned more than a dozen different changes, and would require packaging as individual "commits" as well as discussion and diplomacy.
We got in touch with Helene Martin, one of the ODK developers, and the ODK community was tremendously welcoming and excited about our work. Ping "forked" the "repo" of ODK, flew to Tanzania, and got to work.
There were a few major problems making ODK nearly unusable for line mapping. The constant jumping around of the position due to the network (rather than GPS) fixes, the inability to set an accuracy threshold, and the necessity of starting over anytime anything went the slightest bit wrong were most critical. Ping began by adding configurable accuracy filtering, and created a "backspace" button to erase recent points along the line (so users could simply back up a couple of points rather than starting over).

Every day Ping consulted with Sadah, Felix, (DRAIN MAPPERS), Randy, and Ivan to see what changes would most benefit the team's work. This was a delicate balance between changes that would have the most impact and those that would take the most time; the "quick wins" (high impact and easy to implement) were exhausted quite soon.
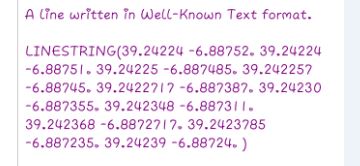
A few issues turned out to be far more complicated than anticipated. For example, ODK exports line traces as a series of points defined by nothing more than four numbers (latitude, longitude, elevation, GPS precision) separated by commas, with semicolons between the points. Mapping software doesn't know what to make of this series of numbers without context, so we changed the format to Well-Known Text (WKT), a geographical text data format that mapping programs such as QGIS, the amazing free-software mapping system that we use, can easily recognize and display.
However, we discovered that this broke ODK! Whenever a user re-opened a survey after saving it, the WKT linestrings had vanished. It turns out that the form-definition language that ODK is based on, Javarosa has a specific grammar for lines - the aforementioned series of four comma-separated numbers with semicolons between points - that doesn't correspond to WKT (or any other geographical format that we are aware of). Without making major revisions to Javarosa (which would almost certainly break other things, probably mostly for people far away who would never know what we'd done to them, but who would really hate us if they found out), we simply couldn't implement WKT linestrings in ODK. We had to "revert the change" and go back to the original implementation that produces output that can't be opened in a mapping program. To solve, or at least mitigate this, Ping wrote a conversion utility plugin(github.com/zestyping/THE LINESTRING PLUGIN) for QGIS to convert the Javarosa lines into proper Well-Known Text.

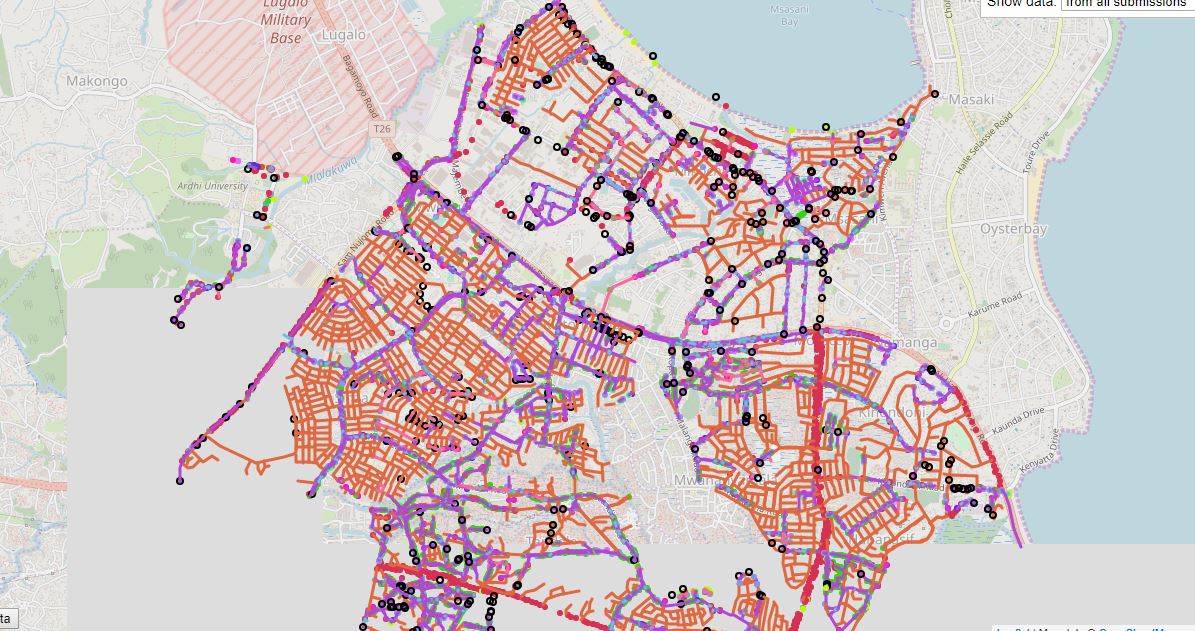
Many technical changes later, we ended up discussing an entirely new issue: the mappers in the university lab trying to make sense of the field data on their computers were finding missing segments and points. The surveyors in the field, despite enormous efforts, especially by Sadah, Felix, and Randy, were still missing occasional features. It was rare, but still enough that the datasets to be sent to the hydrological consultant for analysis were not sufficiently complete and connected. The supervisors were unable to ascertain whether all features had been captured whilst in the field, and had to wait until the computer mappers in the university lab opened the data. We wondered, "what if the surveyors and field supervisors could see every segment and point in real time, so that any missed features can be captured before leaving the neighborhood?" So Ping built a final cherry on top of the cake: an online supervisor's portal displaying the line segment data in real time in a Web page, either on a laptop or on a phone!
![Screenshot_2017-11-01-12-20-46[1].png](https://cdn.hotosm.org/website/Screenshot_2017-11-01-12-20-46%5B1%5D.png)
Finally, we have a software solution capable of capturing GPS lines to the level of accuracy and efficiency we need, the incredible capacity of ODK to input precise data types, and a supervisory tool to help teams complete fully connected drain maps. However, it's not yet time to celebrate, much still must be done. The "fork" with all of our changes to ODK has not yet been integrated back into the main ODK codebase (discussion with the ODK community is ongoing, and more work needs to be done on documentation and packaging). We have mapped seven wards of Dar es Salaam using our methods, but only a small fraction of the mapping has been validated by the hydrological software consultants in the Netherlands; we need to ensure that our work is fully fit for purpose before scaling up to the rest of the city. Finally, we need to document all of our work, package it up, and prepare a playbook for anyone else in the world that could improve urban drainage using community-based mapping!
While Ping worked on software, Randy Jones, a Canadian volunteer who led the drainage team in the field for the first month, has been building a Wiki-based playbook for practical community-based urban drainage mapping based on the methods we've developed in Dar es Salaam with Ramani Huria
We hope that Ramani Huria's work will benefit populations all over the world endangered by floods. Our team right here in Tanzania will be leading the way!
Share