Building a Detailed Flood Model with Community Mapped Drainage Data (by the Resilience Academy)
Posted by Erick Mnyali, Louise Petersson, Hessel Winsemius, Iddy Chazua, Elia Dominic • May 7, 2021
The Resilience Academy partnered with Delft University of Technology to investigate if community-mapped drainage data was suitable for creating an urban flood model.
This post originally appeared on the Resilience Academy Blog.
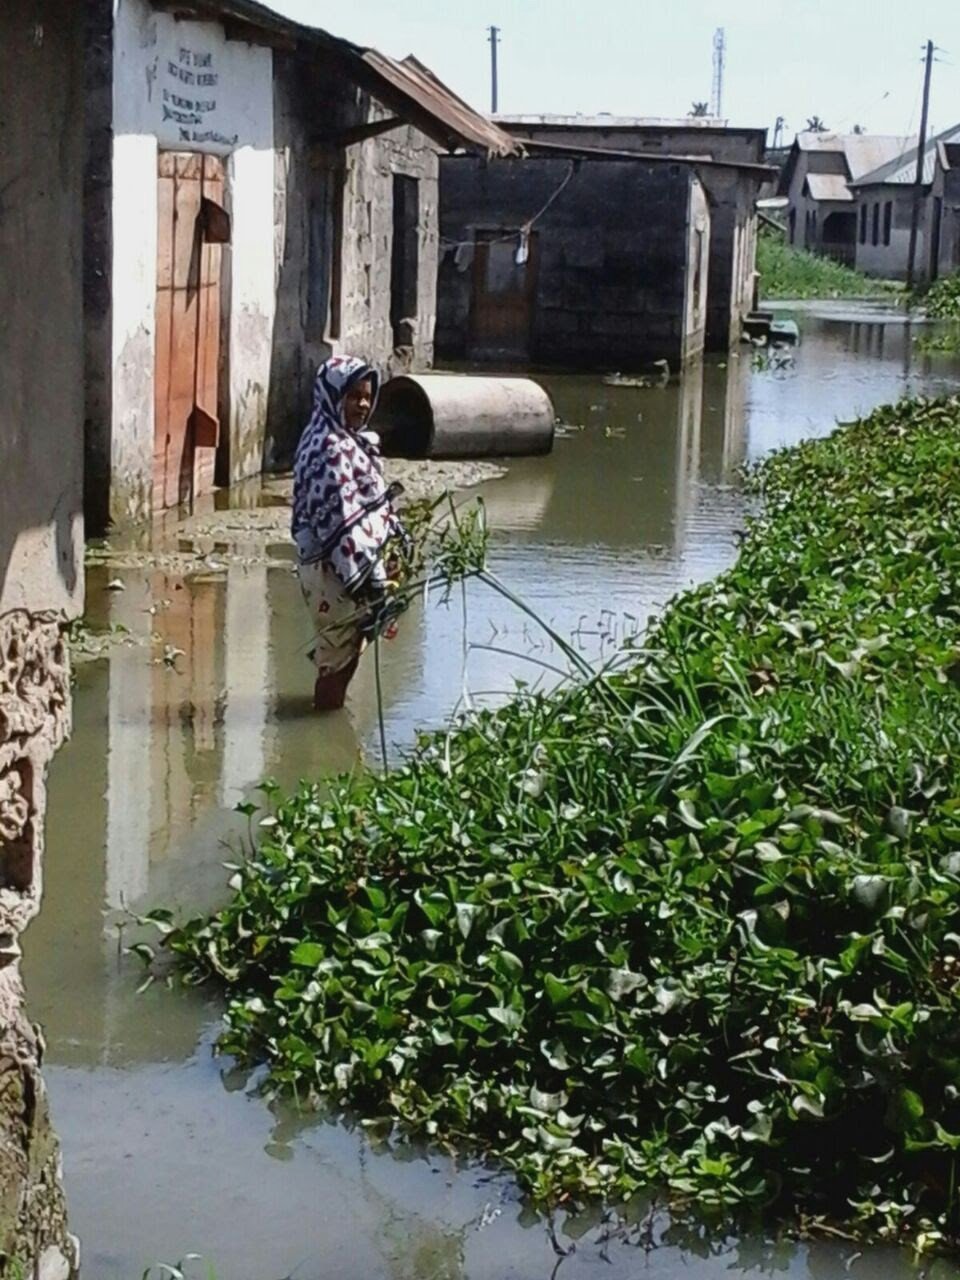
Lead Photo: Street flooding in Dar es Salaam, March 2017. Photo: Chris Morgan
To walk with dry feet on the streets is taken for granted in some parts of the world. But did you know that each and every street in a city must be engineered and designed in a way so that it conveys water into the drainage system, or else the street may get flooded when it rains? And did you know that engineering designs of drainage strongly rely on detailed geometric data about the existing drainage system and terrain data? Many countries are lacking the resources to collect this geometric information and to maintain large databases. How can they then design and maintain a functional drainage system, if they do not have the prerequisite data? The Ramani Huria community mapping project in Dar es Salaam tried to address this issue through collecting drainage data with smartphones using a community mapping approach in the years 2017–2019. The Resilience Academy partnered with Delft University of Technology to investigate if this data is suitable for urban flood modelling through the development of a flood model with community mapped drainage data.
Flood modeling is used to understand where flooding occurs in a city, and what measures you can take to mitigate them. This requires a lot of geometric data, including topography, land use and records of rainfall events. To mitigate flood problems on a local scale, on street level, you need to understand the interaction between surface runoff (rainfall water flowing overground) and the drainage system. In this blog, we explain how a flood model was developed using local resources and devices in Dar es Salaam, Tanzania. The Humanitarian OpenStreetMap Team with its local partner Open Map Development Tanzania was contracted by the Tanzania Urban Resilience Program of the World Bank to collect large amounts of risk identification data of Dar es Salaam. Research Institute Deltares assisted in setting up technical surveys, and the drainage system of Ilala, Ubungo and Kinondoni municipalities was surveyed by university students between 2017 and 2019.
The development of smartphones is a game-changer when it comes to data acquisition across the globe. As smartphones are equipped with GPS-sensors, cameras and internet connection, they are in fact surveying instruments that are available to an increasing share of the global population, also in low-income countries. These surveying instruments, combined with open source applications and data analysis programs, makes it possible for anyone with access to a smartphone to collect geometric data and make maps. With this, the accuracy and quality of data can now be achieved through an ecosystem of accessible components: smartphone applications with clever surveys, trained mappers that know how to map the specific attributes in question in the field, and an extensive and creative (but low-cost!) data validation protocol. An important component of successful data collection with smartphones is conditional surveys, that facilitates that the mapper can only record the data that is relevant for the features in question. For example, round culverts should have a diameter recorded, not width and depth — and a diameter entry should be in a number format, not in text. All such requirements must be correct in the survey to collect a useful data set.
But how accurate is really the data? Is it accurate enough to replace traditional surveys? This was our research question, so we used a systematic approach to investigate the quality of community mapped drainage data and subsequently implemented it in a hydrodynamic modeling software. A full scientific report about the study is found here.
We used a subset of the Ramani Huria drainage data that covered the subwards Mpakani A, Kijitonyama, Bwawani, and Alimaua in Kinondoni municipality. In the figure below, the locations and types of drains in the study area are shown. The drainage elements are divided into four classes: culverts, ditches, drains and decommissioned drains, which in turn can be open or closed and have different cross-sections. Decommissioned drains are poorly maintained, e.g., full of vegetation, building materials or other blockages.
To read the rest of the story, please visit the Resilience Academy Blog.
Share