Building Disaster Resilient Countries/Cities Through Open Spatial Data and Exposure Analysis.
Posted by Hawa Adinani • Dec. 4, 2018

Multiple partners have come together under the Meteor project, which aims to understand risk and disaster exposure in order to create resilient cities. Through open data, a model will be created that can later serve more than 46 countries in the most affected countries.
What is the Meteor project?
Modelling Exposure through Earth's Observation Routines
Meteor is a three-year project funded by the UK Space Agency to develop an innovative application of Earth Observation (EO) technologies that will improve the understanding of disaster exposure. The project focuses on two pilot countries - Nepal and Tanzania. Meteor involves eight consortium organizations from across four continents. Their expertise spans from humanitarian aid to remote sensing and disaster risk reduction to policy advice.
Tanzania and Nepal were chosen as pilot areas because of their differing exposure and hazard types; earthquakes, landslides and flooding as well as each countries history of past disasters. After project completion in both countries, the process and models developed will be replicated in at least 46 developing countries.
Project Aims
Meteor aligns with Sustainable Development Goal 13; to reduce the number of deaths and the number of people affected by disasters, and to strengthen resilience and adaptive capacity to natural disasters. The project aims to develop and deliver more accurate levels of population exposure and built environment exposure to natural hazards in vulnerable countries. This will be achieved by assessing and understanding the risks using available data.
In Tanzania, Meteor is working closely with the Disaster Management Department of the United Republic of Tanzania to ensure that the project is effectively received by local partners dealing with disaster management. A major challenge when making Disaster Risk Management (DRM) decisions is the poor understanding of the distribution and character/ type of exposure in Official Development Assistance (ODA) countries. Exposure needs to be mapped, monitored and modelled by governments, NGOs, affected communities and businesses in order to strengthen resilience and growth. Quantitative methods are required to justify resilience decisions and risk mitigation. The project will build and strengthen local and global resilience through collecting complete, up-to-date and accurate exposure data in order to better identify risk. This will enable a more effective decision-making process and build capacity of local decision makers to apply data and assess hazard exposure.
What is HOT doing?
We will contribute towards the open global exposure data for multi-hazard risk assessment through our expertise in developing the OpenStreetMap (OSM) data, community-led projects and technical skills with open data platforms (Tasking Manager, Export Tool and OpenAerialMap). HOT works globally to build local mapping capacity and add data to OSM. This is a great source of geospatial exposure baseline data for many cities, especially in poorly mapped places, particularly Africa. Our team in Tanzania are working on digitizing aerial imagery to create a dataset of homogeneous zones, sampled in different areas such as planned, unplanned, scattered and less populated areas. Ground truthing and data collection of different infrastructure will be the next step.
Task Creation
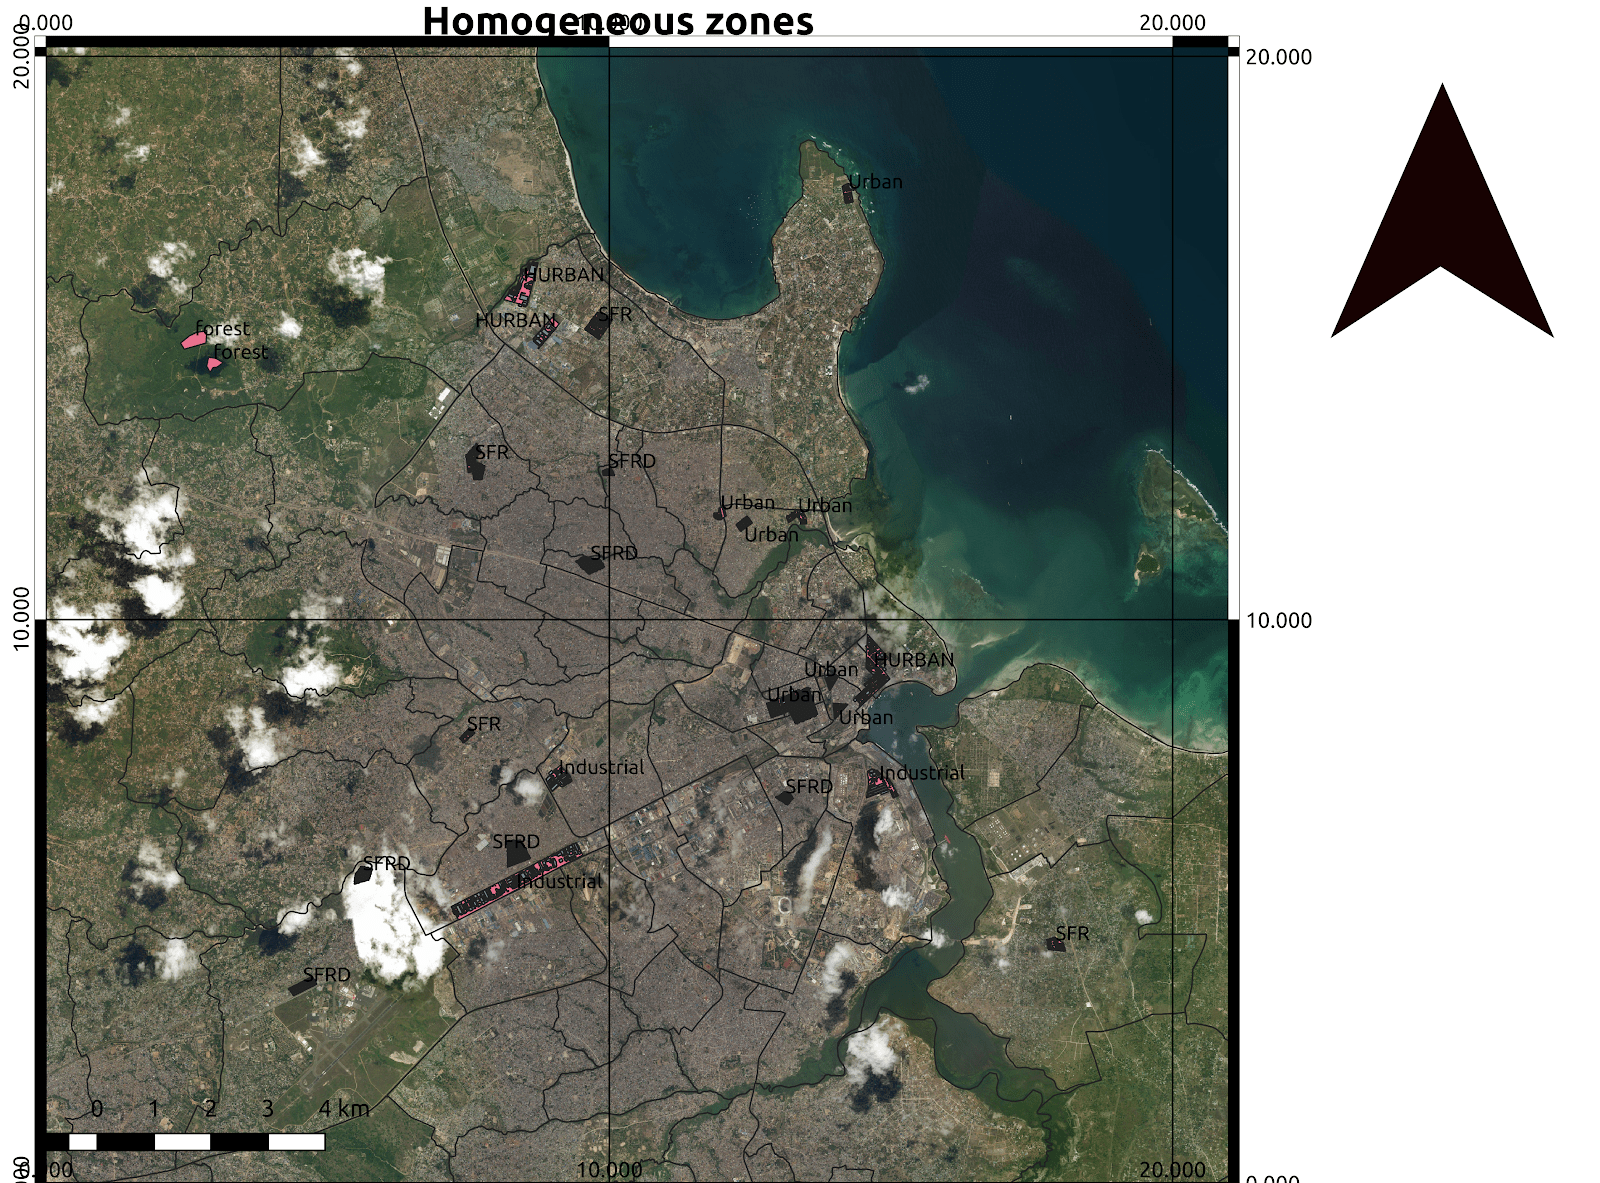
The tasking manager is an OSM tool to manage and create tasks. We were provided with homogenous zones for areas of interest and using QGIS as a tool, were able to split the homogeneous zones into multiple polygons for tasks creation in geojson form. The geojson for the multiple polygons are used to create the area of interest in the tasking manager for projects. The homogeneous zones consist of different land uses such as formal and informal settlements in urban areas or peri urban areas together with industrial areas. Some parts of these areas were already mapped and contained some metadata so specific instructions were issued such as insisting mappers did not delete any existing features and values inside them. The following diagram shows the distribution of homogeneous zones polygons.
 Digitization of Aerial Imagery by HOT- team in Tanzania; Photo, HOT, Tanzania.
In just five days, our team of twenty mappers based in Tanzania digitized 10,955 buildings. This was achieved using 6 cm resolution imagery, provided by the Ministry of Lands, Housing and Human Settlements. All 10,955 buildings were in different homogeneous zones such as industrial, planned, unplanned, shattered as well as less populated areas.
The following map shows traced buildings in provided homogeneous zones.

The surveyed data on OSM will be tested along with country-wide datasets developed by ImageCat, a leading provider of risk and disaster management technologies. The testing enables us to see their suitability for purpose by randomly selecting buildings from the same patterns in established homogeneous zones, then validating two focus areas to assure they are fit-for-purpose.
Share