Developing a Web Map Repository of Kampala’s Informal Settlements (by Resilience Mappers)
Posted by Benjamin Dills, Sophie Mower • Jan. 6, 2021
Resilience Mappers has built a web dashboard for geospatial data to support efforts by the Ugandan government to help residents of low-income communities who have been most affected by Covid-19 lockdowns.
The growth of informal settlements, slums, and poor residential neighborhoods is a global issue. The rise in urban population in cities like Kampala is no exception. The characteristics of these settlements, such as high density and unplanned, crowded houses, together with a lack of infrastructure, have led to acute problems including drainage, sanitation, and solid waste management.
In April 2020, the Uganda government launched a relief program to distribute food to the vulnerable poor in the urban settlements of Central Uganda. The recipients were motorcycle riders, taxi drivers, manual workers, etc., who work hand-to-mouth and were directly affected by the drastic measures to contain COVID-19 infections.
With support from a Community Impact Microgrant, we were able to train seven mapping communities on how to contribute to OSM for the informal settlements. We employed several geospatial tools ranging from remote mapping to validation of data to equip as many volunteers as possible to help in mapping these settlements. These tools were Java OpenStreetMap Editor (JOSM), iD-Editor, and Mapillary.
 Training participants on how to use iD-Editor on zoom
"...I was really eager to learn, and indeed I benefitted especially from Mapillary training," said Evelyne, one of the mappers.. "I had never used Mapillary to that level! I have been mapping using JOSM and iD-Editor, and the Mapillary plugin makes it more enjoyable!"
With the COVID-19 restrictions, the informal settlements could only be mapped remotely. Data obtained from remote mapping included outlines of buildings, land use types, and roads covering over eight sq km of the settlements. With transferable skills in JOSM and iD Editor, our community was able to map the buildings, land use, and roads in the 15 informal settlements of the Kawempe division of Kampala using satellite and aerial imagery.
 Nabuwembo Maria, a resilience mapper, contributing to OSM
While using remote mapping from aerial imagery was the best option available, it still contained errors and had to undergo a series of revisions before being visualized to provide useful information. From the concept of “garbage in, garbage out,” it was important that the data collected was cleaned to remove errors and also eliminate unnecessary attributes before visualizations were made. We used tools such as ArcGIS, QGIS, and Open Refine during the data cleaning workflow.
We visualized the data in two formats, static maps and ArcGIS Online web maps. These visualizations were designed for donors and stakeholders targeting interventions depending on the types of M&E questions that could be answered. For example, how many people in an informal settlement are served per water point and the number of residents who have access to a health facility.
Since there was no single inventory that could be accessed by members in the community and aid agencies in these settlements, we created a web map repository for Kampala’s informal settlements. It offers several benefits over paper maps, such as being quick and efficient to monitor, easy to update, allowing quick retrieval and queries, and offering faster integration of complex, multiple spatial, and non-spatial datasets.
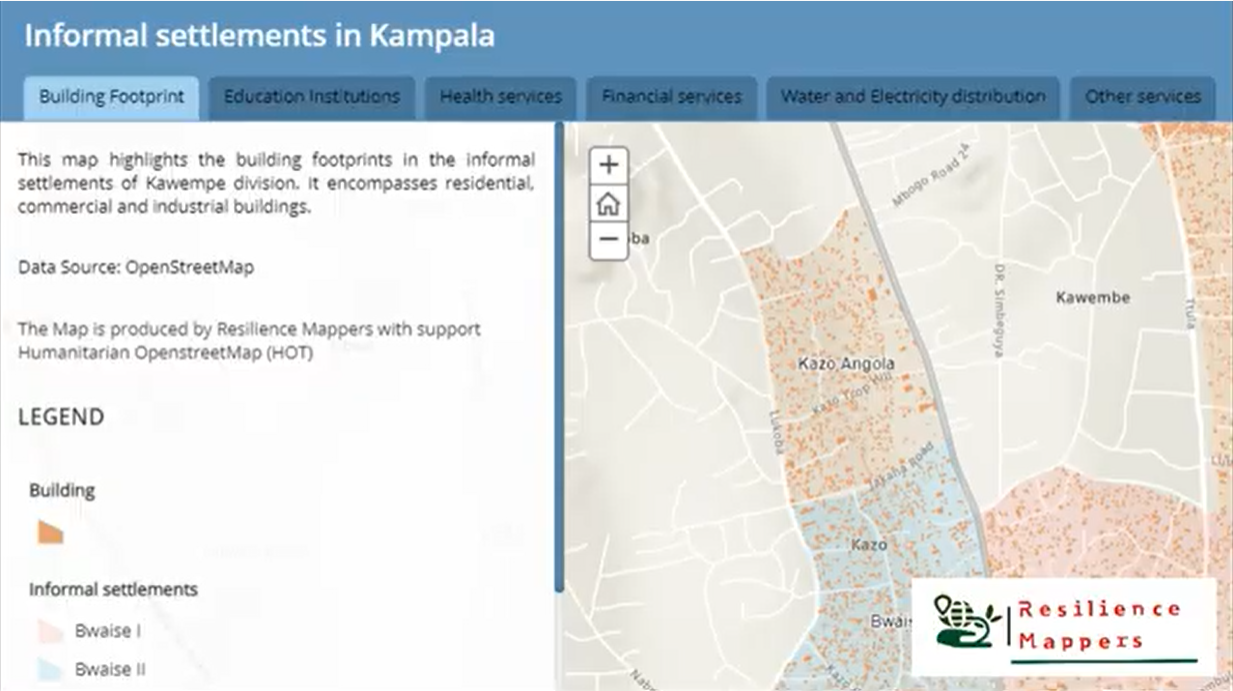
Statistics such as population in these informal settlements, such as the number of services available, the number of buildings, or the number of illegal waste dumping sites, could be visualized on a dashboard, which can be accessed by community members, aid agencies, government agencies, and donors.
 The web map dashboard illustrating the services in informal settlements.
Besides having a successful outcome, we learned many lessons from challenges. Continual discussions and meeting with the stakeholders, especially the data users, is vital. This helps you drive your activities based on the data needs of the data users. It also provides ideas and schemes that could make your data more beneficial to other related authorities in case they may need it at one point.
Secondly, the division of labor and allocation of activities among the project leads could help a lot for management and working faster. It also ensures that you have greater efficiency on an activity, which saves time and costs, creates less strain, and produces higher quality work. Additionally, it's important to set deadlines and ensure you meet them. Procrastination leads to financial loss and work backlogs. Setting strategies and deadlines to meet them drives you to be faster and more productive.
So... What next?
Having realized that most data and information in the informal settlements are not documented, we are working closely with KCCA and Actogether to devise means of collecting and updating the information in these settlements. Data about services such as schools, sanitation, waste management, and health facilities ought to be collected, preferably through fieldwork, so as to create more meaningful information in addition to this project's deliverables.
Share