News — 28 May, 2018
Map Completeness Estimation and Experimental Analytics for Health

Over the last couple of years, HOT has been working with partners like the Clinton Health Access Initiative (CHAI) and the Botswana Ministry of Health and Wellness on malaria elimination. As these experts move towards using OpenStreetMap data to plan spraying spraying campaigns, distribute prevention supplies, and prioritize geographies of the mission, we’ve been working on better ways to understand map completeness using machine learning, quality and progress of mapping. Today, we’re sharing a preview of the work of our partners at Development Seed and Azavea on expanding the ecosystem of tools under OSM Analytics - HOT Analytics for Health.
Why Analytics for Health?
We’ve been in Botswana the last few months, conducting a full assessment of households and validating a remote mapping campaigns completed by the HOT community. This work is driving Indoor Residual Spraying (IRS) planning in the coming year by generating a high resolution dataset that identifies buildings and neighborhoods for malaria elimination.
Understanding data quality and completeness is paramount when it comes to leveraging OSM data for health applications. Along with our partners, we’ve built the analysis around five lenses:
-
Geographic coverage - how does OSM data compare to a population coverage?
-
Attribute relevance - does the data have attributes that are relevant and complete for certain health applications?
-
Recency of edits - has the data been recently edited? What was the age of the source imagery used?
-
Data errors - what is the degree of errors within the data? Are there overlapping or duplicate data?
-
Logical consistency - are buildings located within a lake or a swamp, incorrectly?
All of these questions help answer trustworthiness and potential use of OSM data for health analyses. We’re taking a focus on malaria elimination programming initially as we experiment and prototype.
HOT Analytics for Health
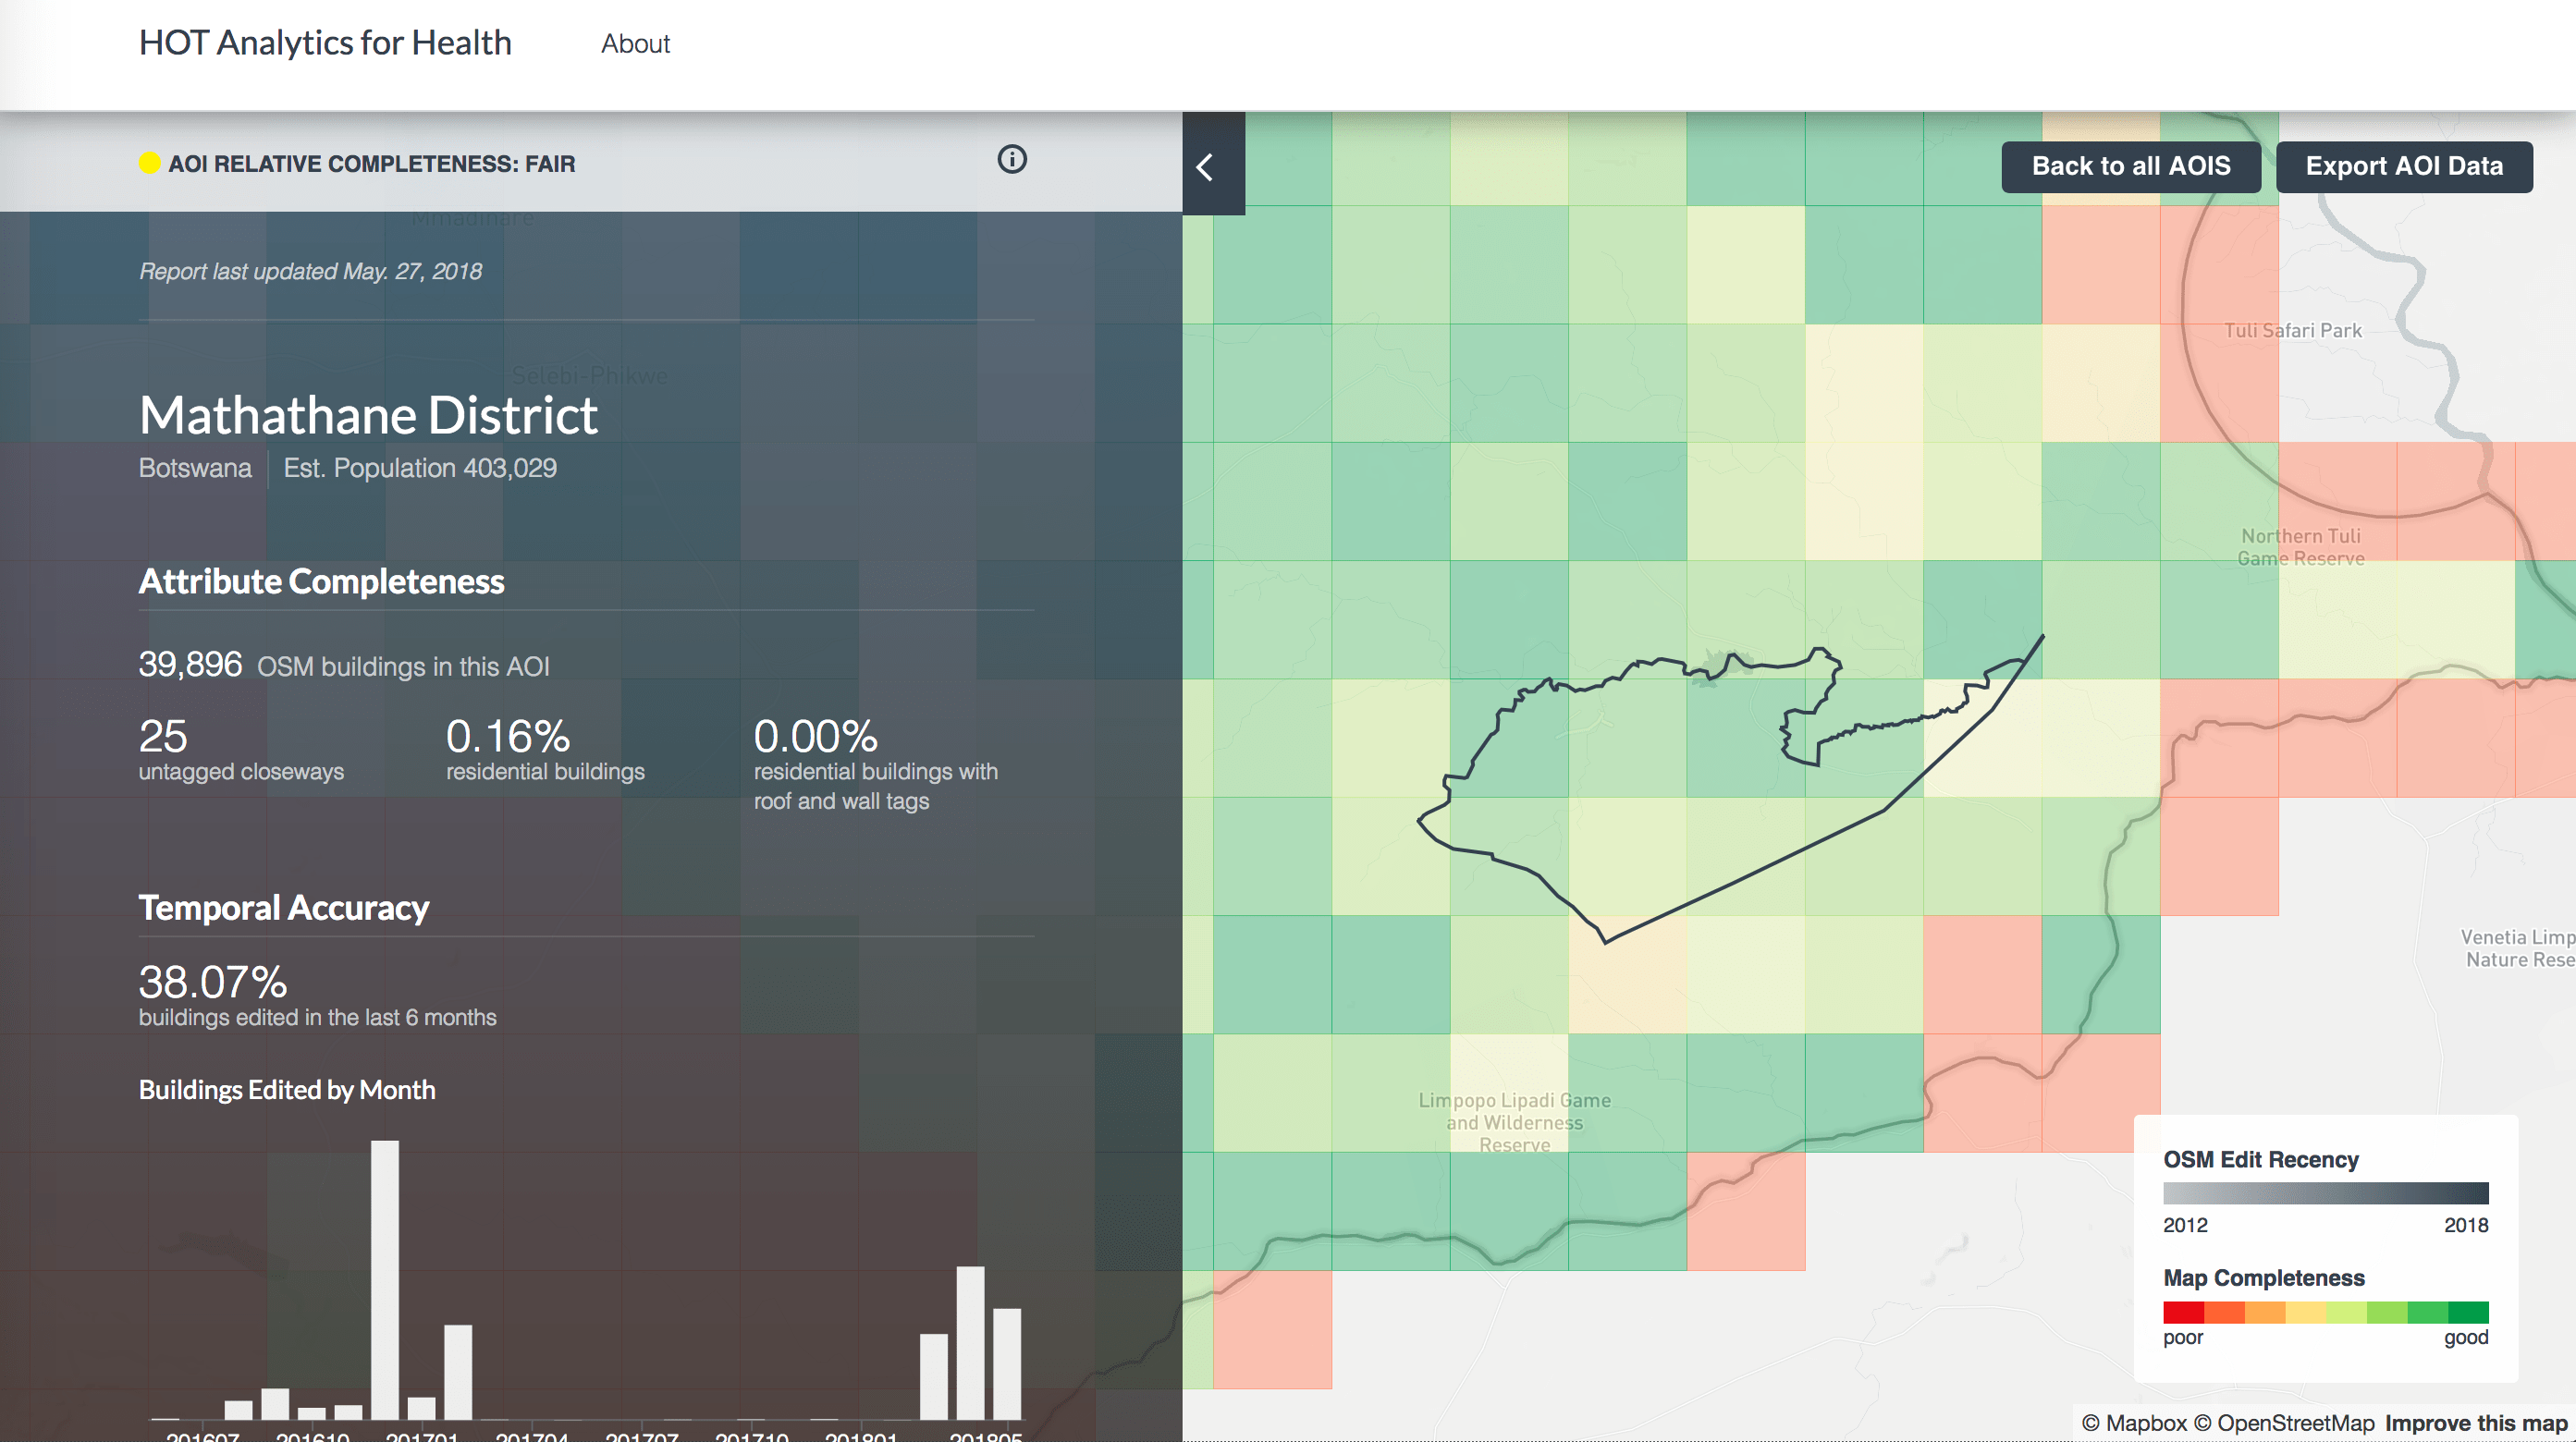
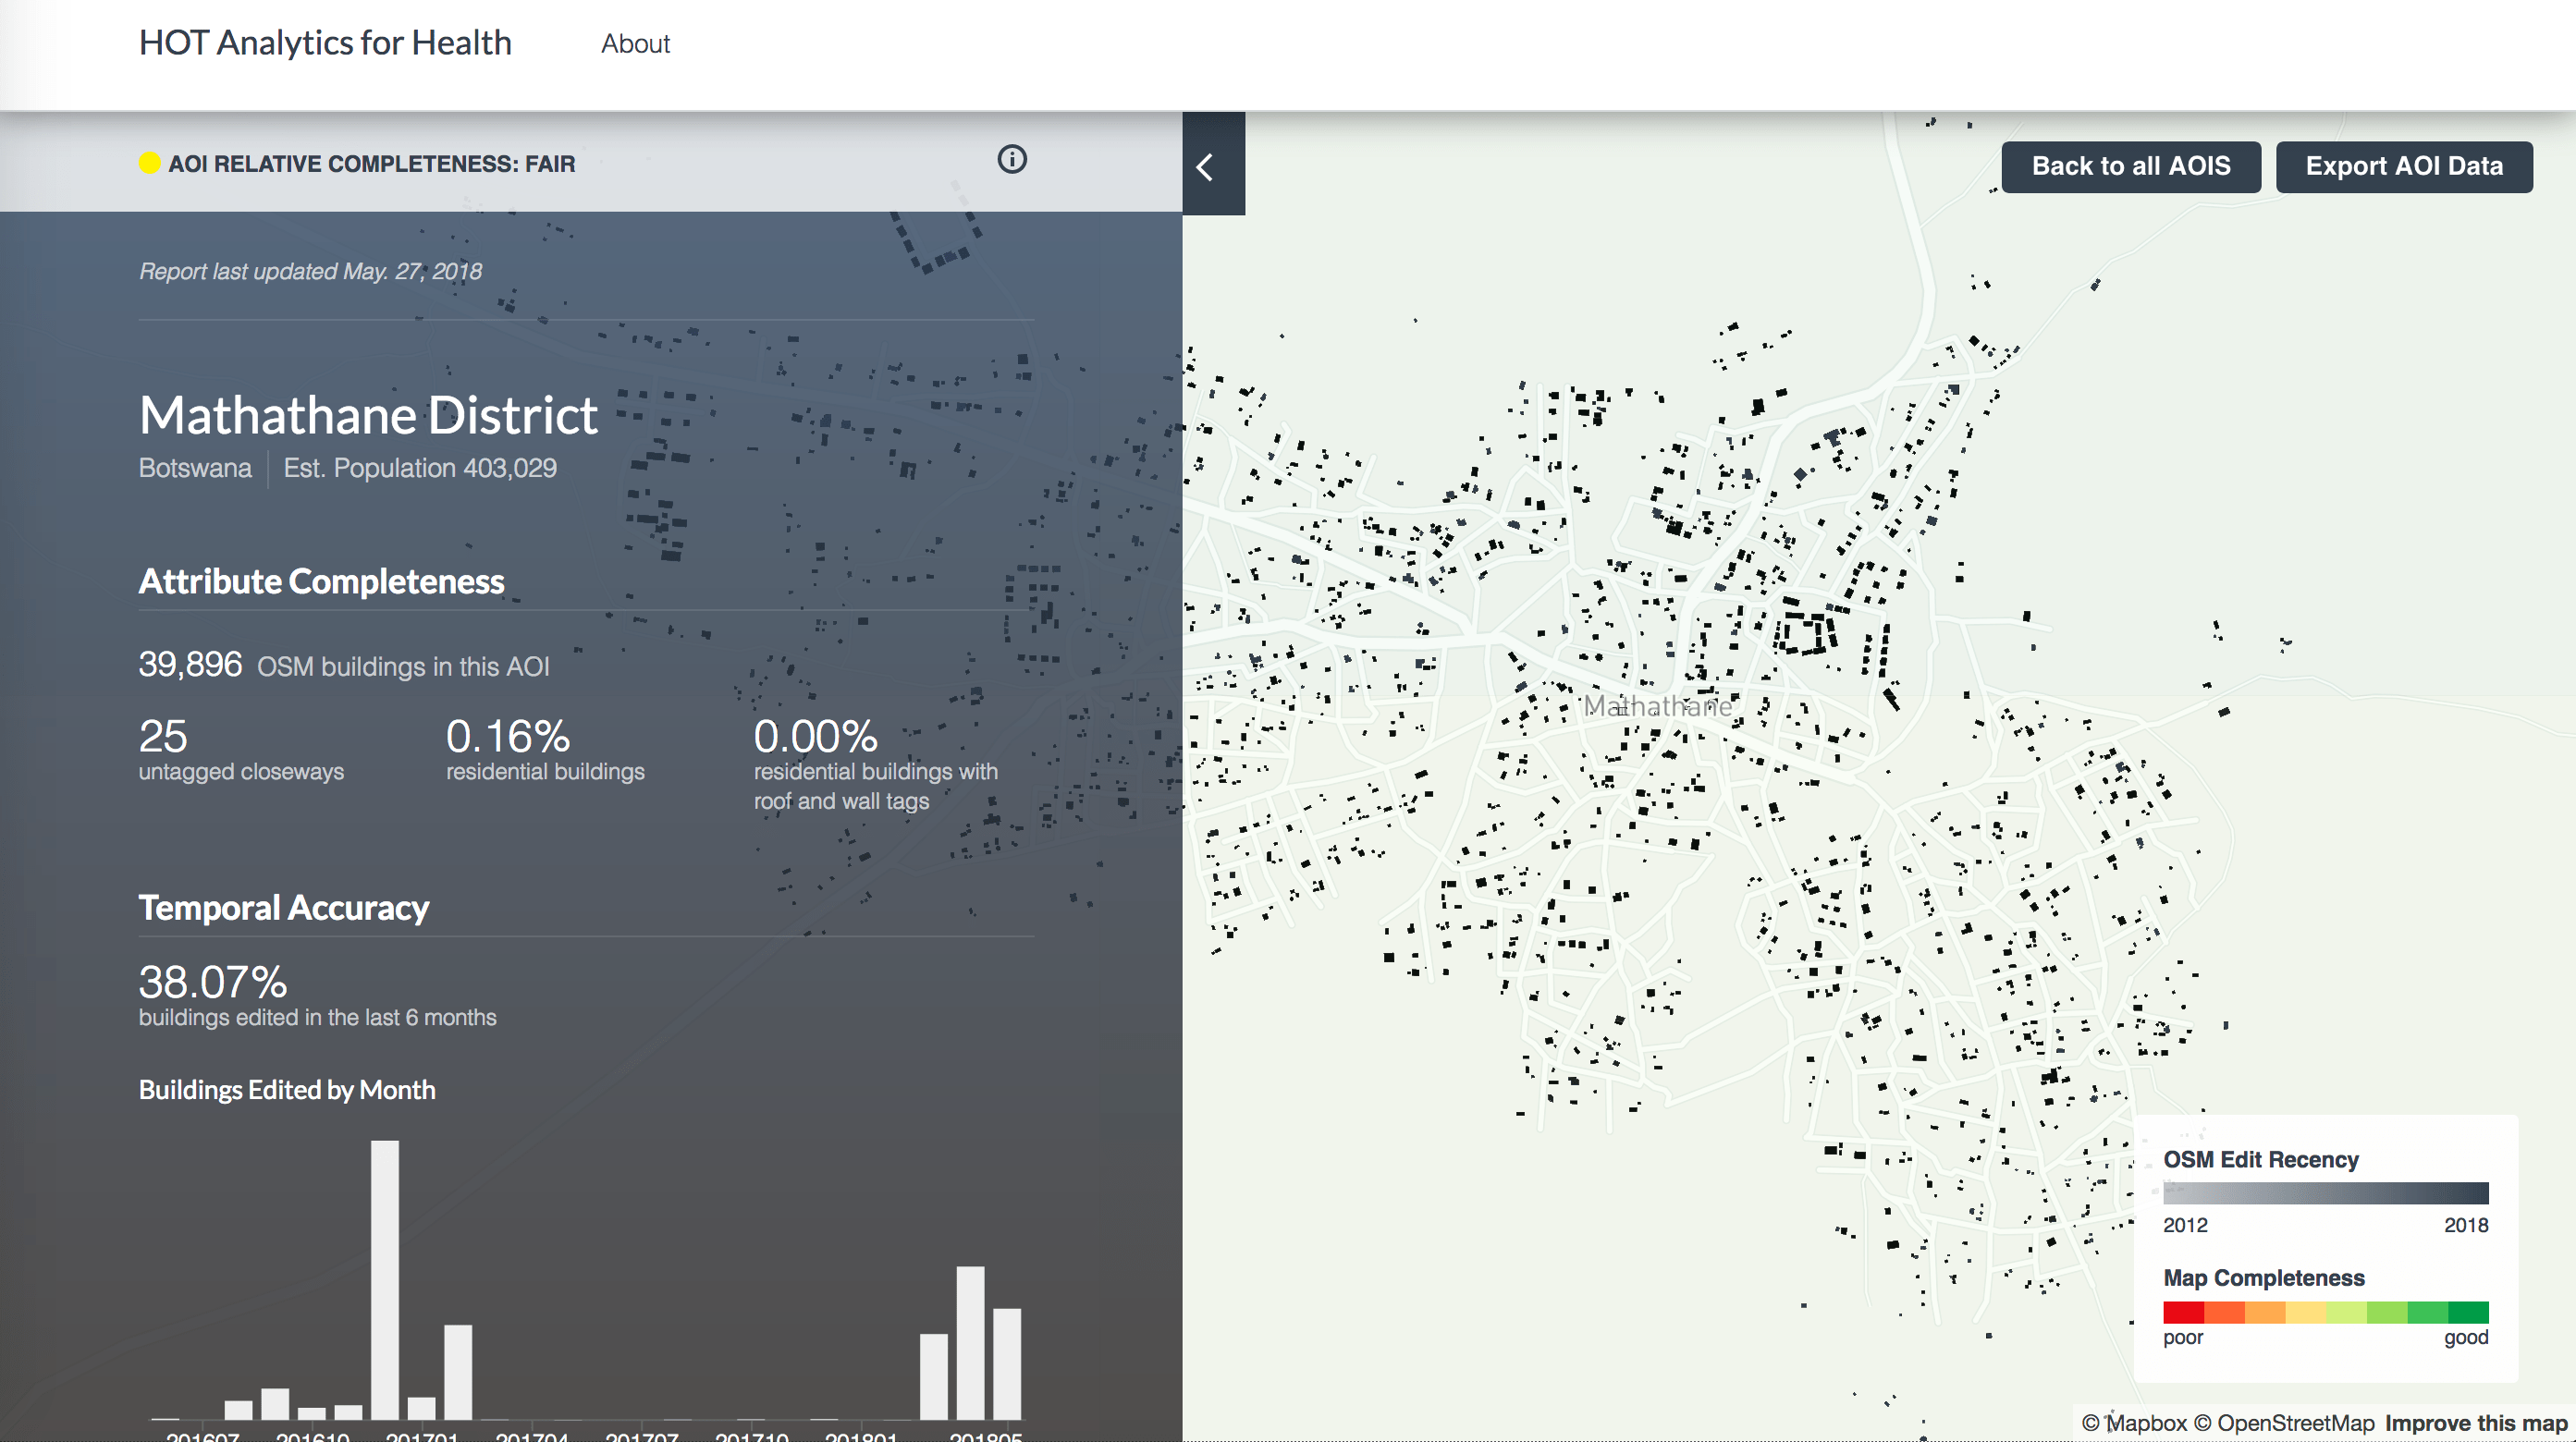
HOT Analytics for Health extends our previous work on OSM Analytics, but looks at the above specific areas to generate reports to understand if the data is ready for Malaria prevention.
One of the biggest areas of our analysis was experimenting population based map completeness metrics. This approach uses machine learning to build a model that correlates population density in a given geography, and compare this with distribution of built-up area that’s mapped in OpenStreetMap. The model uses population density distribution per 100x100m, rasterizes OpenStreetMap building data to compare them for building completeness in OSM. This process is illustrated below:

Apart from completeness, we use rule based analysis to understand quality of the building geometries and attributes. This analysis uses OSM QA Tiles and OSMLint.
What’s Next?
While this analysis is indicative, there are some pitfalls - estimates of WorldPop population depend on administrative census data. These estimates data varies in quality and recency from country to country. OSM QA Tiles is prone to causing marginal over or under estimation on the boundaries of the geographies. We’re taking a hard look at how we communicate this data to help public health practitioners and data analysts use the tool to assess OSM. Please join the conversation if you have any feedback.
Over the next month we’ll be working on improving performance and further developing the tool. Keep a watch here for updates on the progress.