


Pourquoi les évaluations des dommages peuvent varier : des pixels d'image aux micro-ondes
Publié par Jessica Pechmann, Claudio de los Reyes • 6 août 2026
Summary
After two earthquakes hit northern Venezuela on 24 June 2026, at least seven rapid damage assessments were released from seven sources, each using different methods, and each producing very different estimates of the number of buildings damaged. Understanding why they differ and what they are showing is what turns the data from the assessments into actionable intelligence.
One reason for the differences is that remote automated assessments are always an estimation. The estimations will improve as methods are refined and ground truthing reports are incorporated in the models. Another reason for the differences are the methods and imagery used:
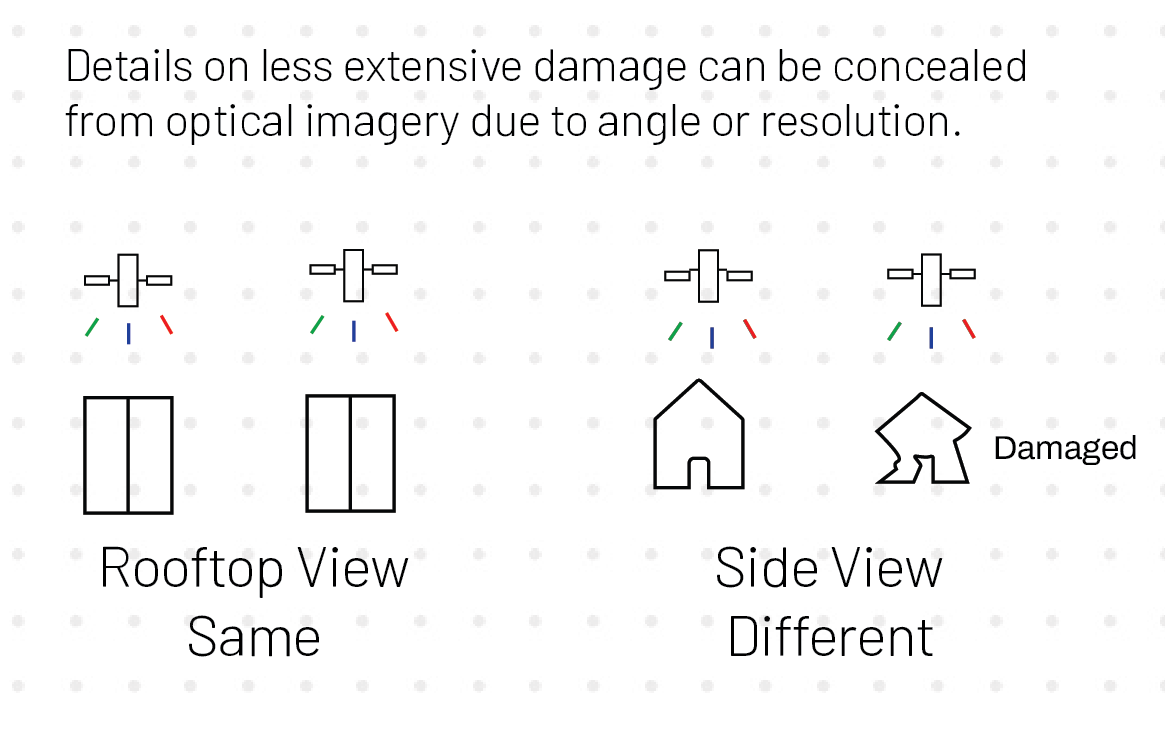
- Optical imagery (true color - ideally high resolution) will likely only pick up the most damaged areas, damage visible from above or to the roof.
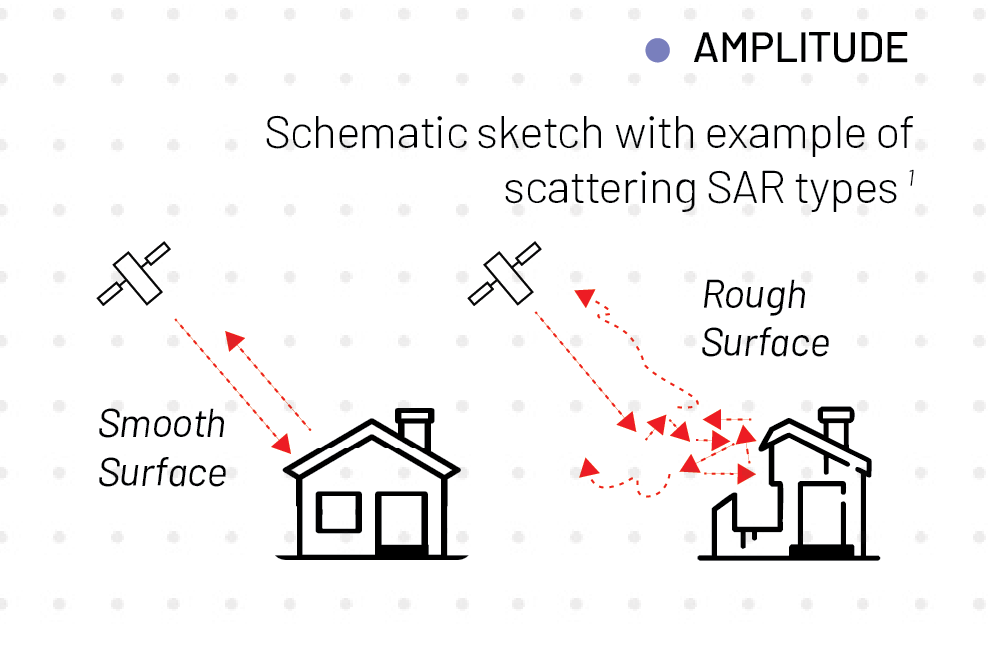
- Radar (SAR) will likely pick up a wider range of damage, from more minor damage to extreme, because it can detect damage from different angles (i.e., damage to building foundations or facades).
Understanding what each assessment can and can’t show is important for any informed use of the assessments. Read on to find out more.
Background
Two earthquakes, magnitude 7.2 and 7.5, struck northern Venezuela near Morón on June 24, 2026, just 39 seconds apart. The 7.5 that hit second was roughly twice as strong as the 7.2 in ground motion, and together they produced the longest, most damaging shaking Venezuela has seen in over a century, with the rupture sequence lasting close to two minutes. The quakes hit Caracas, La Guaira, damaging buildings and triggering hundreds of aftershocks. As of July 5, close to 3,000 people are confirmed dead, over 12,000 injured, and more than 41,000 remain missing, with officials expecting the toll to keep rising as search and recovery continues.
As with any humanitarian response that is over a large geographic scale, remote damage mapping with AI is an increasingly common way to understand a disaster’s impact, identify areas for immediate response, and advocate for recovery resources. However, navigating damage assessments that do not agree can be challenging - which one to use?
In Venezuela, there are at least 7 available remote earthquake damage assessments available (see OCHA’s dashboard compiling the different damage data). This active damage mapping space echoes our study following the increase in conflict in Lebanon in late 2024, where we found at least 9 assessments that covered the same time period and areas (2 assessments released after publication of this report). Understanding what each one is showing, and how it differs from the others, is essential. And, not all “damage” assessments are showing the same definition or understanding of “damaged”.
How optical and SAR (Synthetic Aperture Radar) Differ in Identifying Damage
Optical: Optical imagery is produced by the visible light spectrum, such as an aerial photograph. Damage detection from optical can be manual - careful interpretation of an image for visible damage by a person, either to the roof or sometimes inferred by visible rubble, or automated (AI/ML). One strength of using optical imagery is that a human can visually see the damage in the image for verification. The limitation, for either manual or AI optical interpretation, is that you will only identify damage that is visible from above, or from the angle of the aerial image.
SAR: Synthetic aperture radar detects damage by identifying a change in surface texture from any side of a building. Radar signatures that travel from the sensor to the building and back are compared between before and after a damaging event. The strength of radar is its ability to detect damage from all perspectives from the sensor. The limitation is that you might not be able to see the SAR detected damage on an optical image, making it difficult to verify the damage remotely.
What does this mean for identifying earthquake damage with optical vs SAR?
A 2025 study following the 2023 Türkiye earthquakes, which compared multiple remote damage methods to ground truth data, found that in Turkey, earthquake damage is mapped more comprehensively and accurately by radar satellites than optical imagery. But why? Radar will always pick up damage from perspectives that optical cannot see, such as from the side - which is particularly relevant for earthquake damage. When buildings shake in an earthquake, the force coming from the ground up will usually first cause damage to the facades/sides and foundation (cracks, bricks falling, etc). When the shaking to the building gets prolonged/strong enough, the damage will then move to the roof or the building will collapse - sometimes causing the roof to break, although sometimes a roof can remain intact (fig. 1).
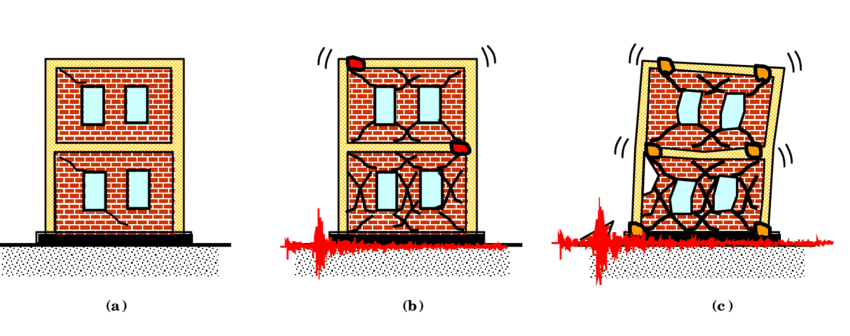
(fig. 1) Sequence of damage in an earthquake (Source: ResearchGate).
Note on other damage sources: earthquake damage is different from other disasters such as fire, wind, or conflict - whose movement/blast impacts can come from multiple angles, not just the ground in an earthquake.
Viewing earthquake damage from above (fig. 2): Using the European Macroseismic Scale (EMS-98)’s damage scale, earthquake damage visible from above would in most cases only be possible at substantial to heavy damage (Grade 2 or 3).
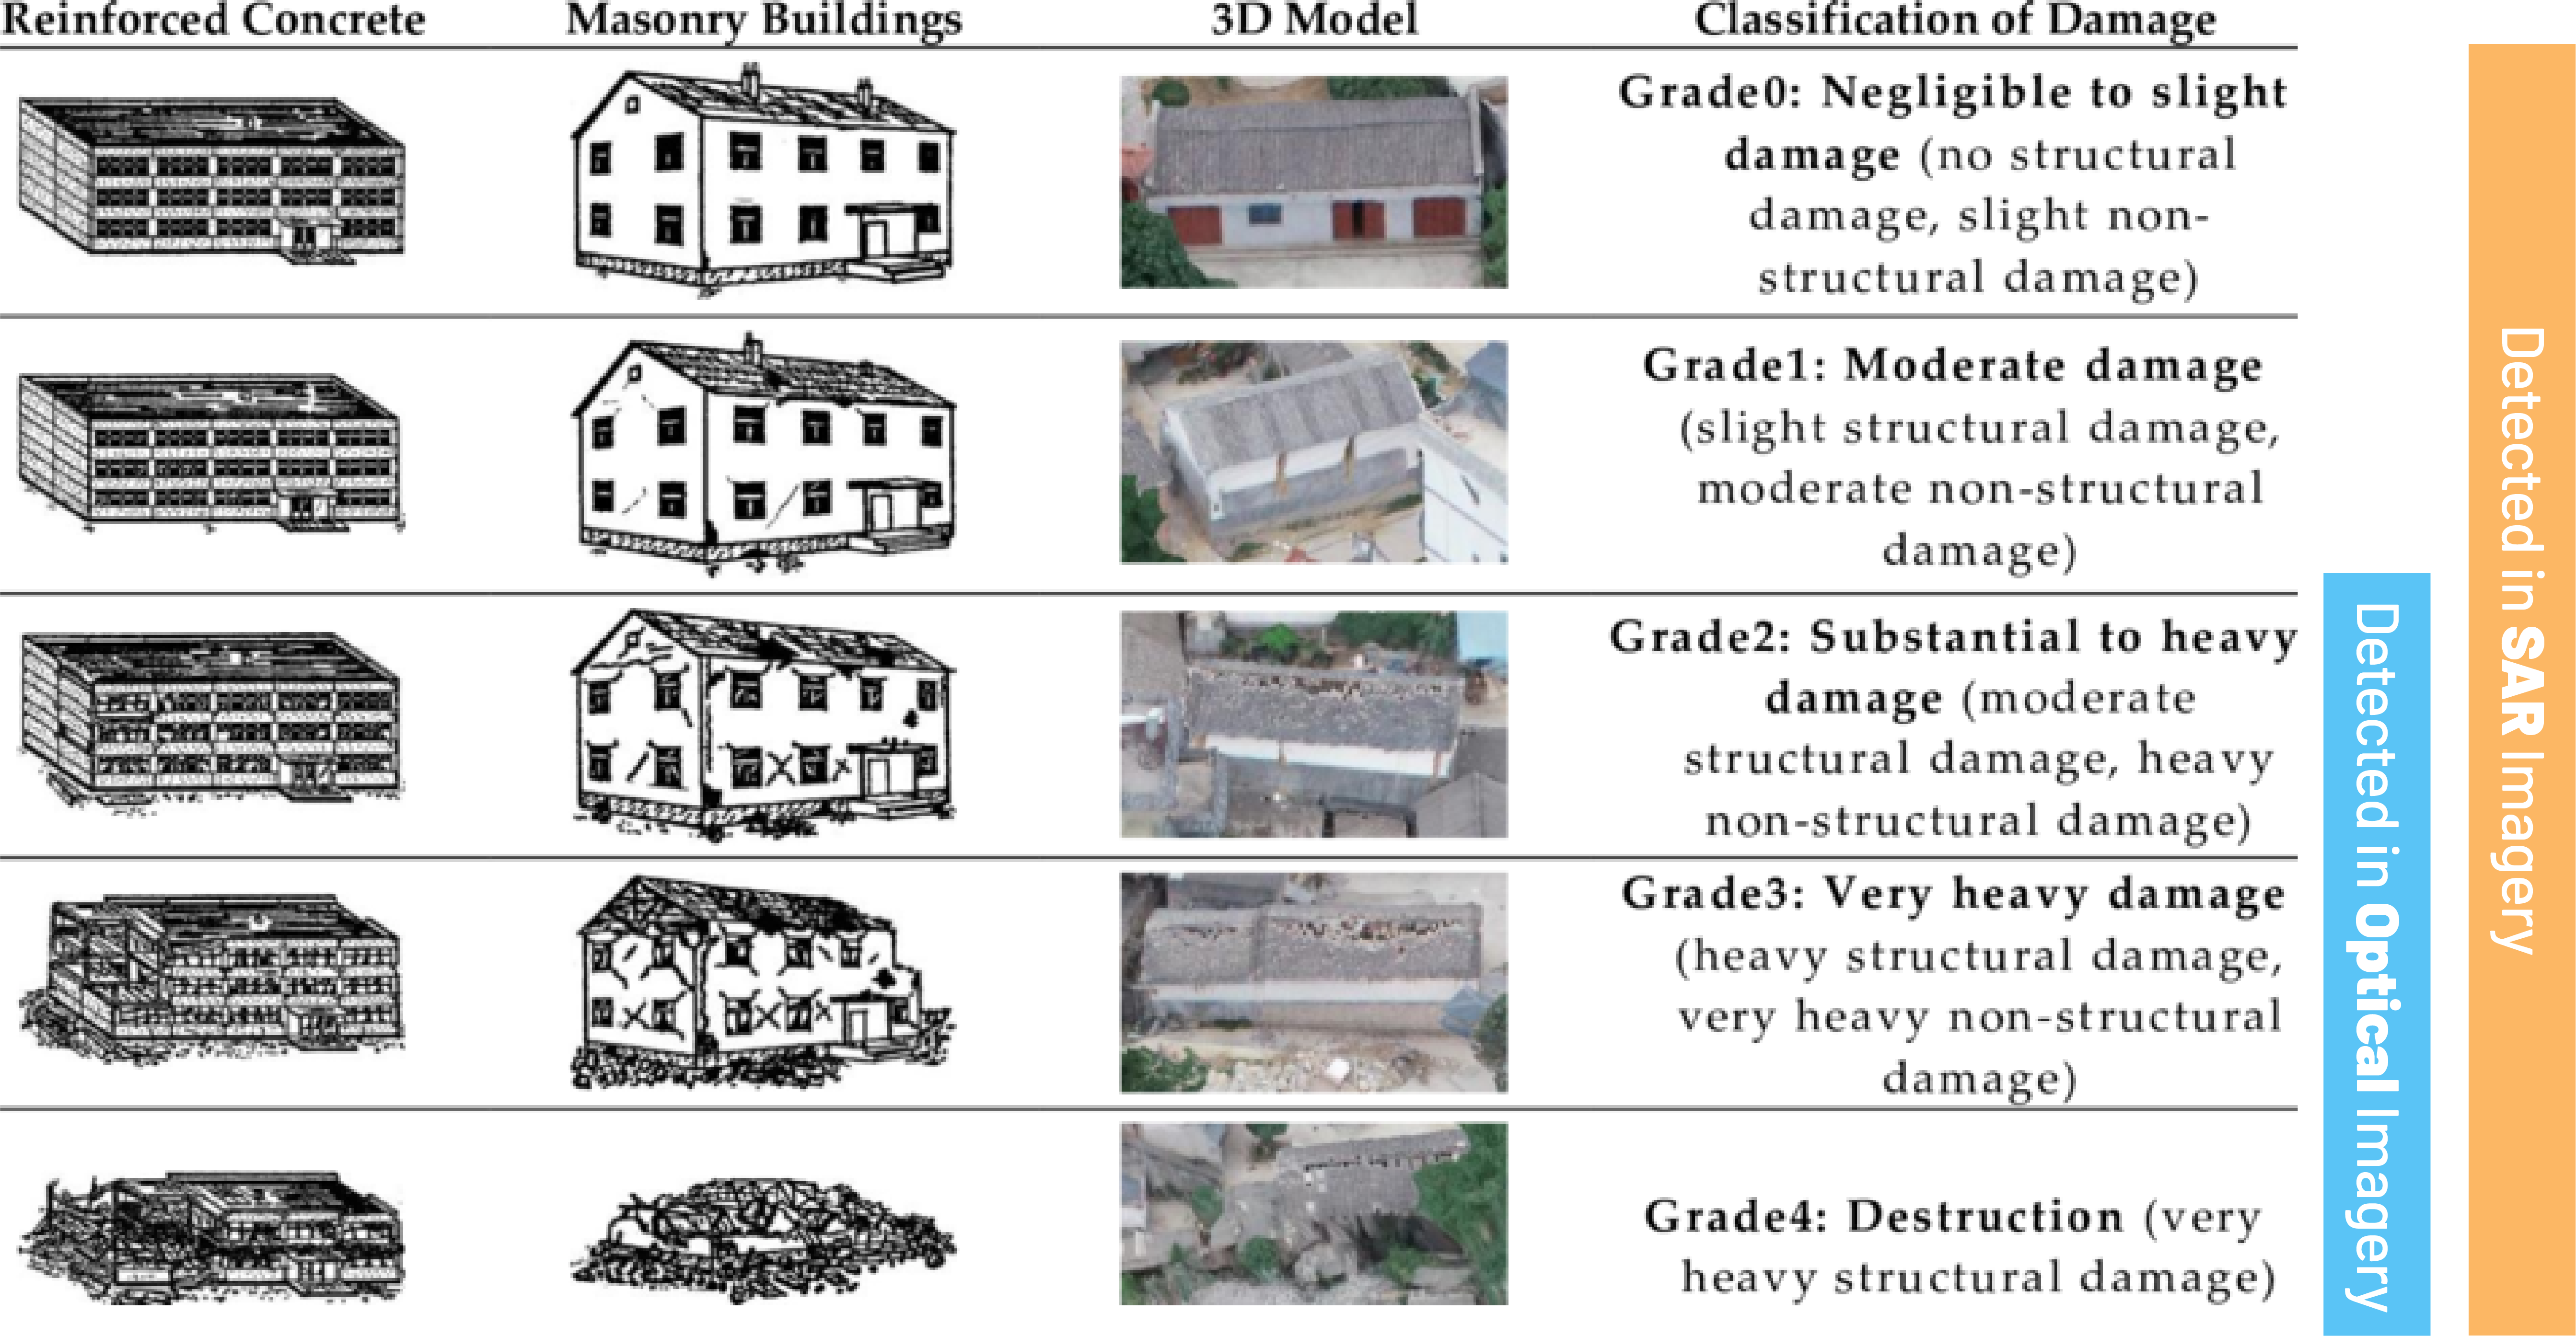
Figure 2 - European Macroseismic Scale (EMS-98) Grade 0 to Grade 4 visual table
When considering the different types of damage (not just scale - fig. 3) most types of structural failure from an earthquake would not be visible from an aerial viewpoint.
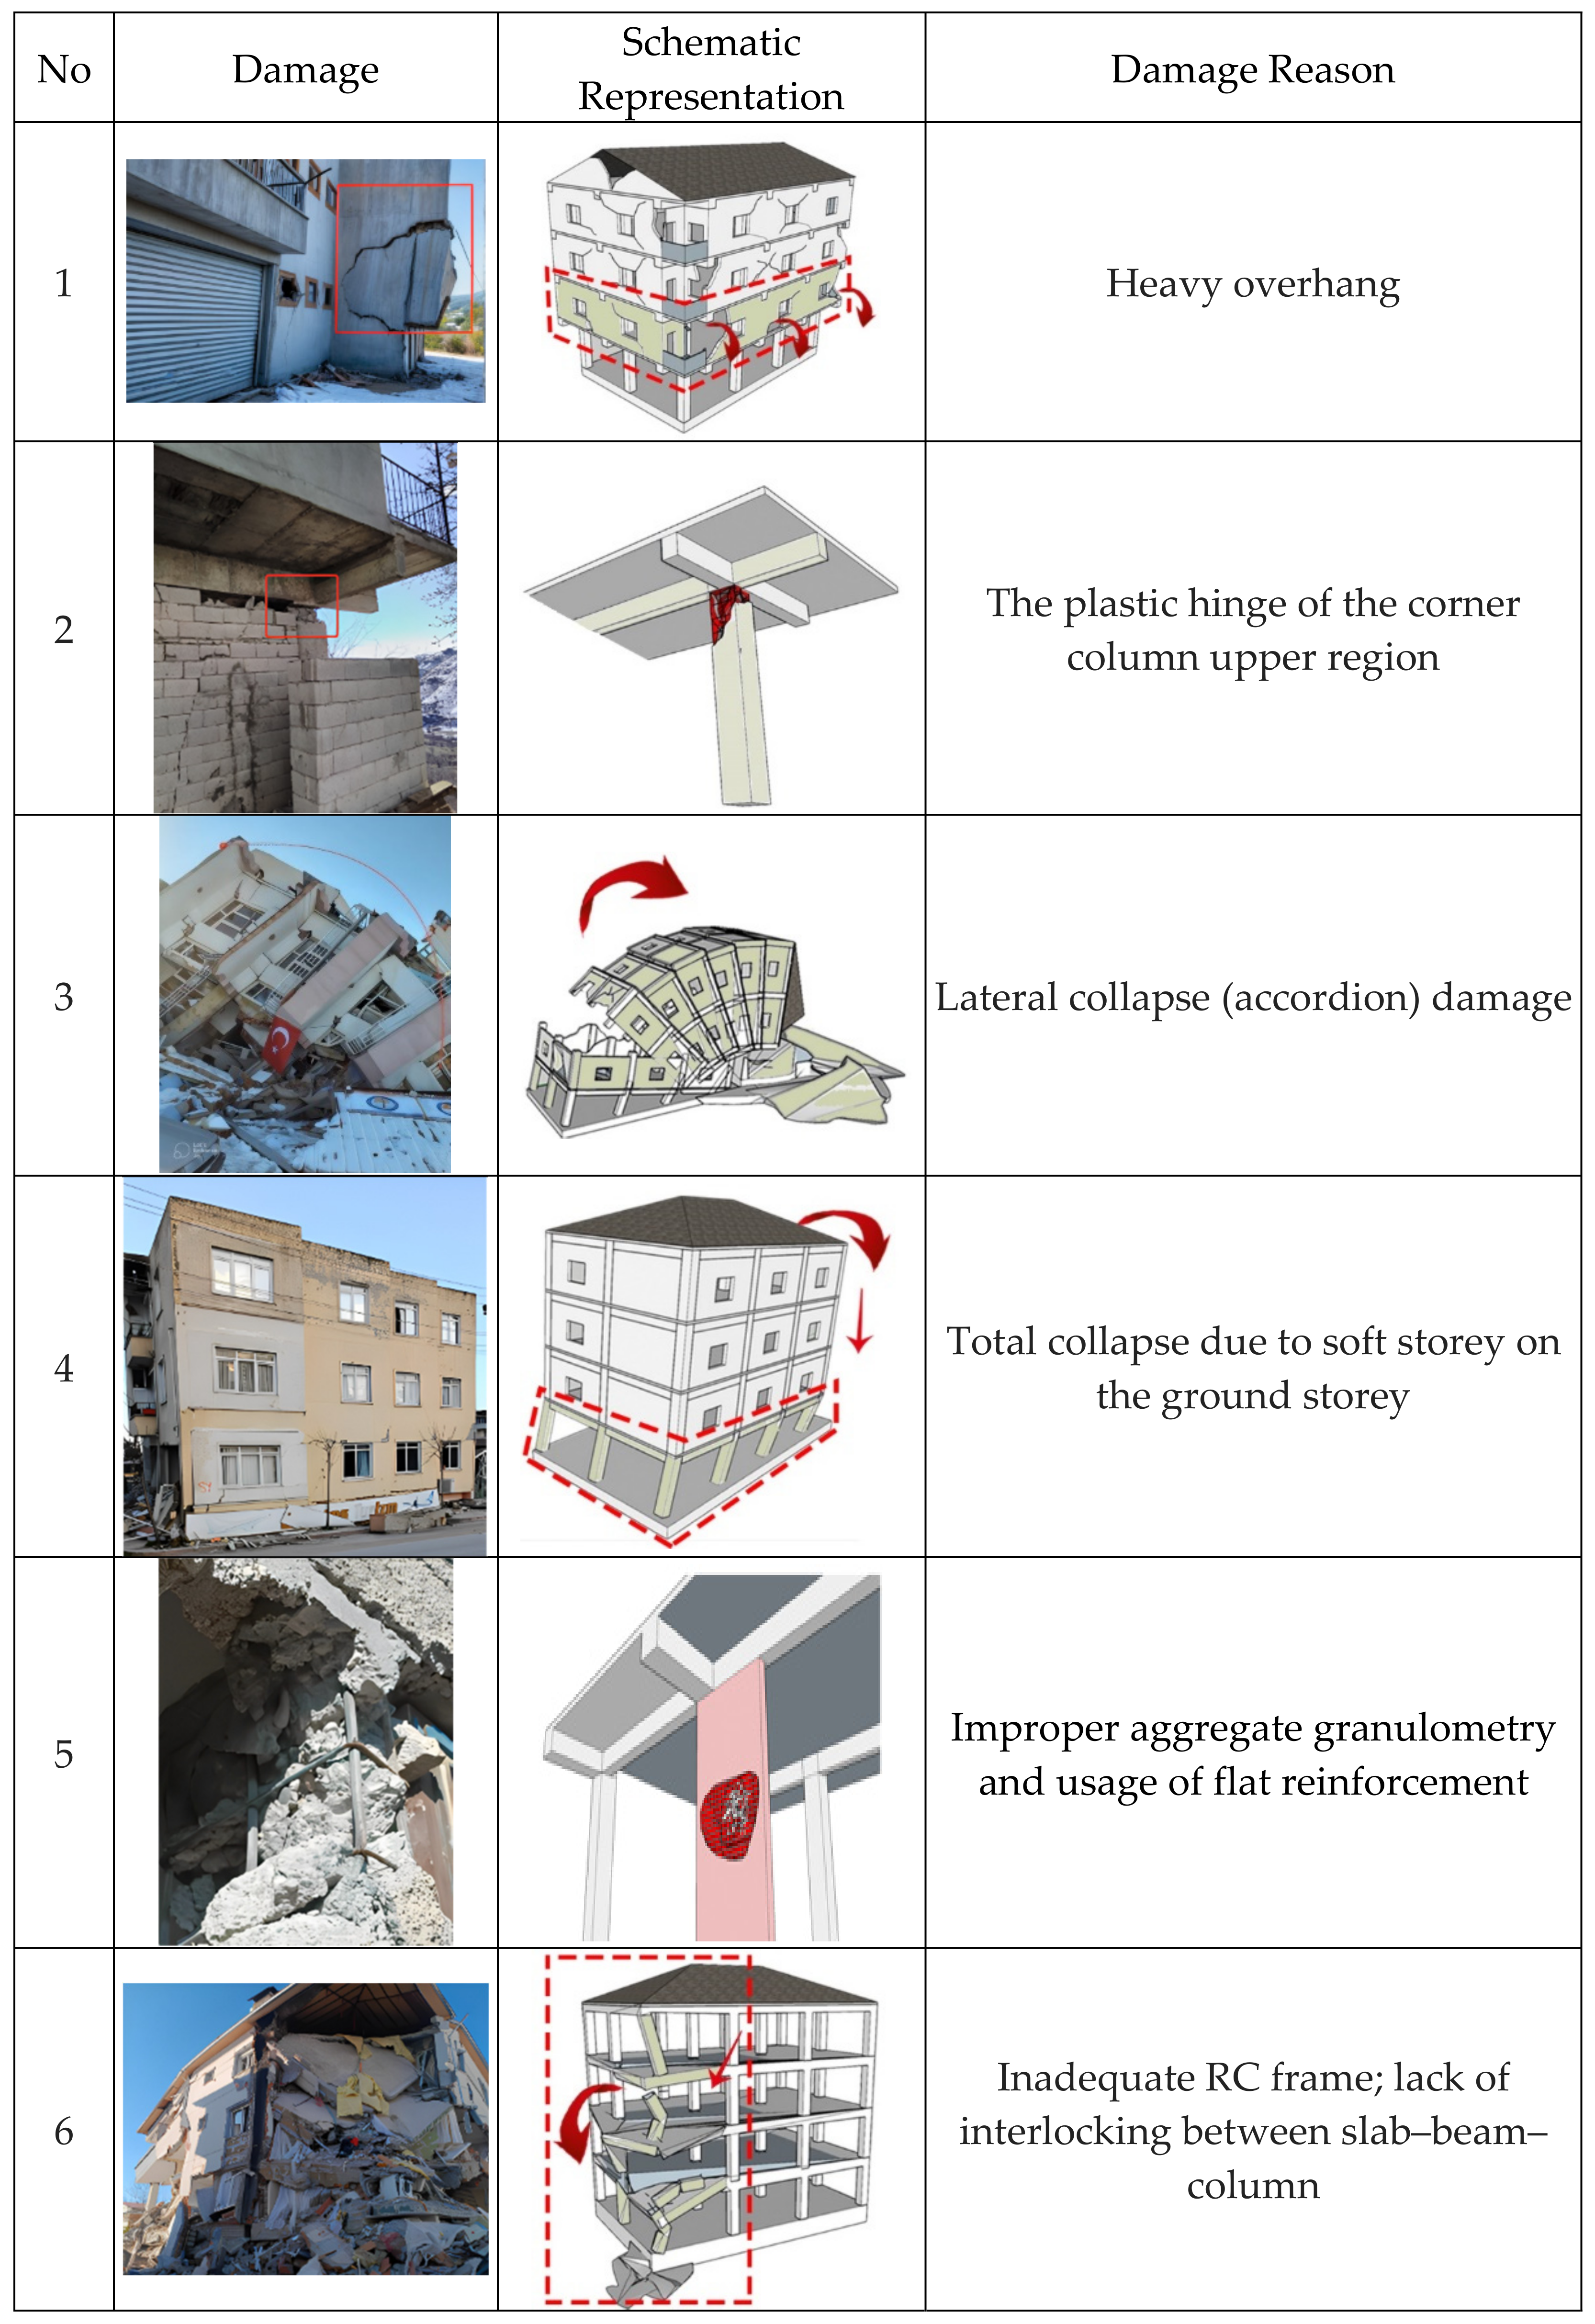
Figure 3 - Structural parameter failures (Pancake collapse, short column, torsion, shear damage)
What we are seeing in the earthquake damage assessments in Venezuela
In a simple comparison of Microsoft (Optical) to Oregon State University (inSAR) in Urimare, there were more damaged buildings detected by inSAR - note damaged counts for both methods varied across geographic area and level of shaking intensity. To validate either dataset requires ground-truthed data.
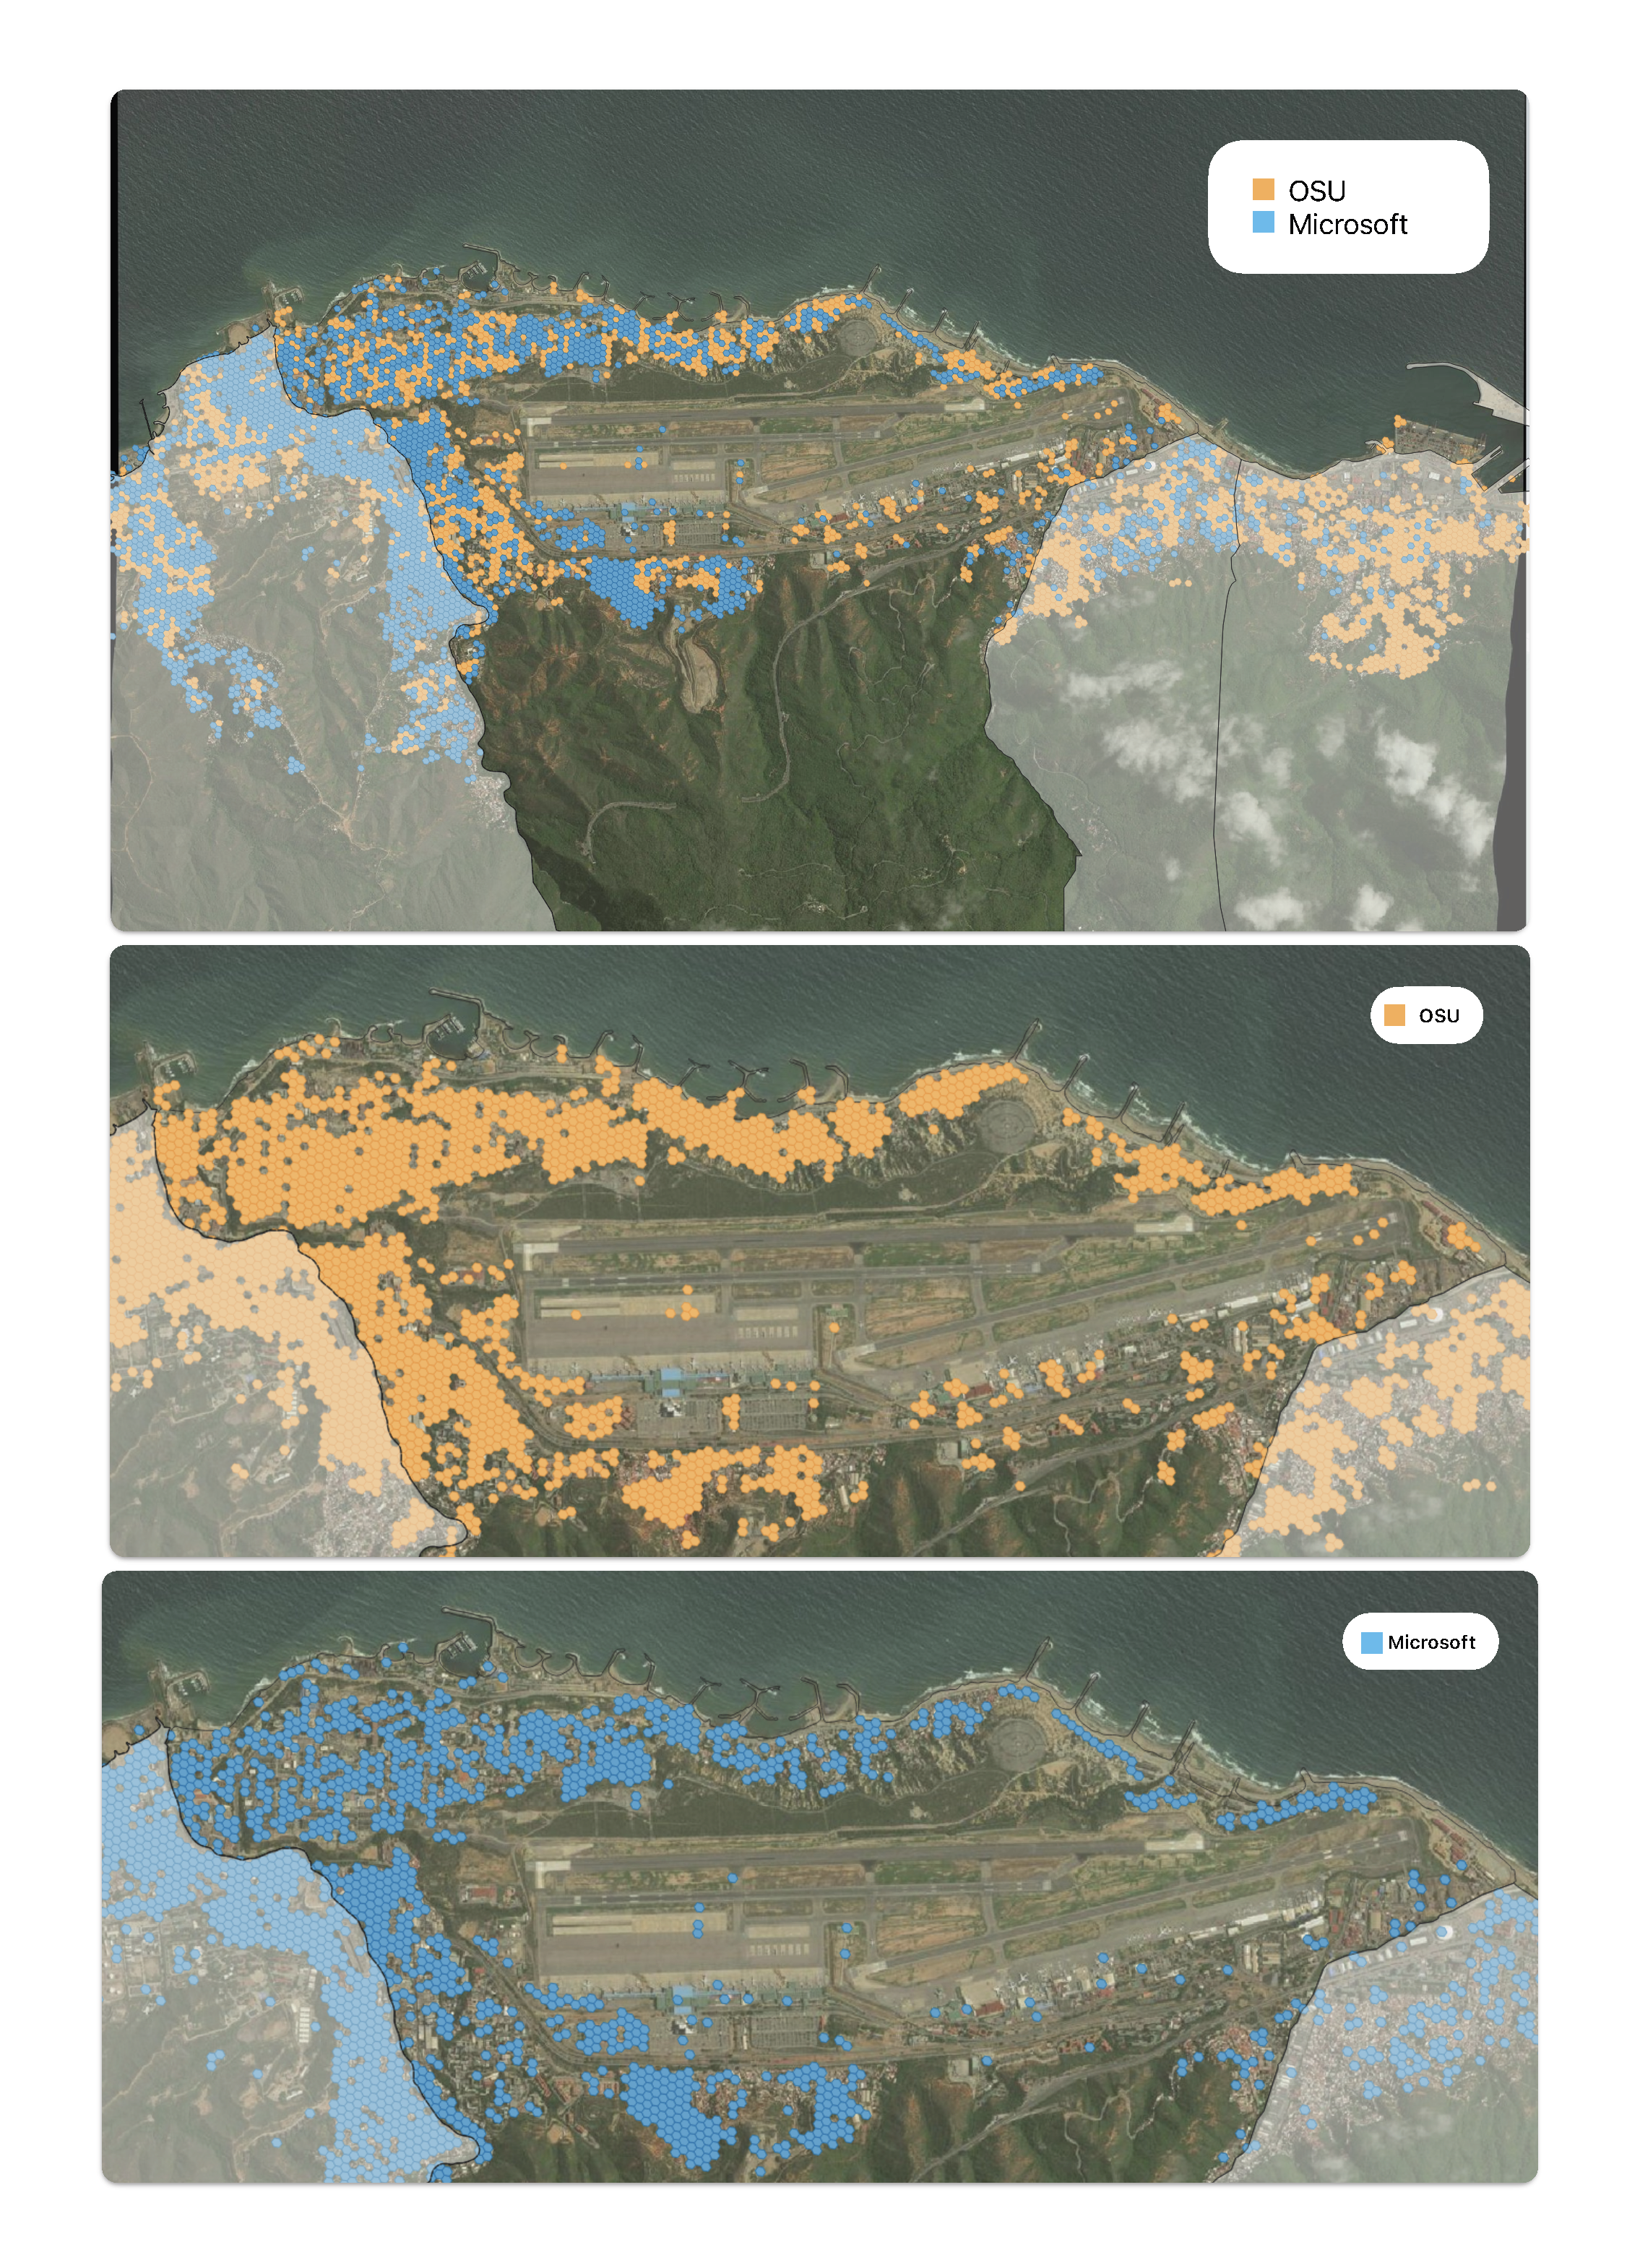
Figure 3.1 - Structural parameter failures (Pancake collapse, short column, torsion, shear damage)
| Method | ■ Microsoft (Optical) | ■ OSU (Radar) |
|---|---|---|
| BUILDINGS POLYGON | ||
| Total Buildings Detected | 10,390 | |
| Damaged Buildings (%) of total | 1,620 (15%) | 5,417 (52%) |
| HEXAGONS | ||
| Total HEX Surveyed | 2,108 | |
| Damaged of Surveyed Areas (%) of hexagons | ■ 1,065 (50%) | ■1,639 (78%) |
| Intersect (Microsoft ∩ OSU) | 1,025 hexagons | |
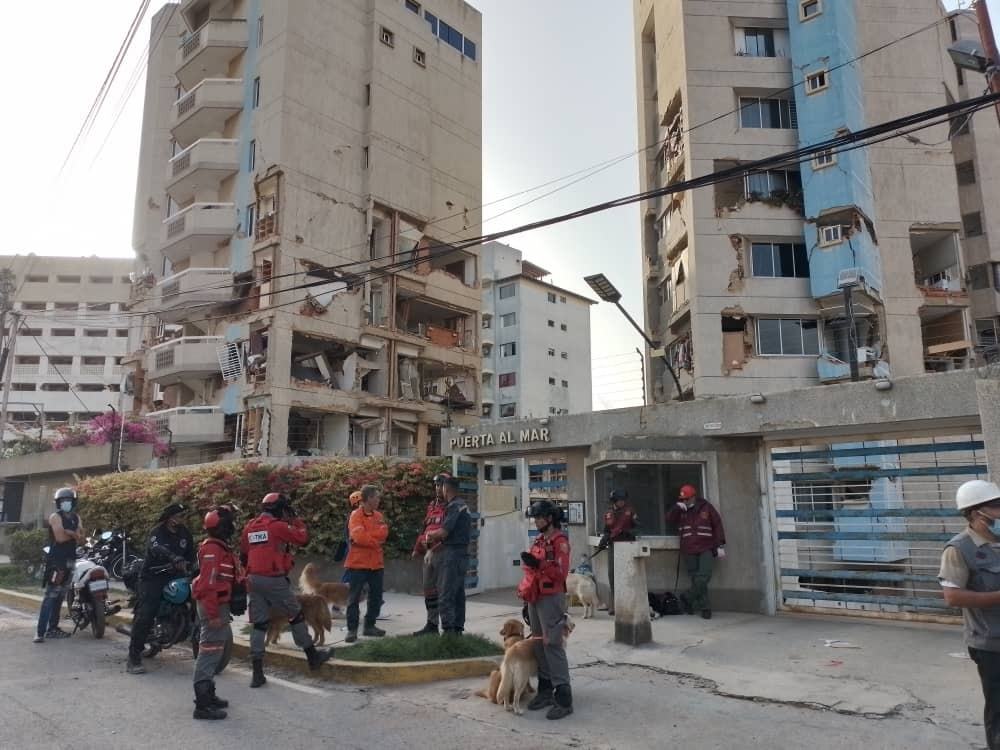
With HOT’s ChatMap application which is currently being used by volunteers in Venezuela to capture damage on the ground, we’ve been able to confirm examples of where SAR identified damage that is extensive from a ground perspective, but not viewable at all from an aerial perspective on optical imagery (fig. 4).
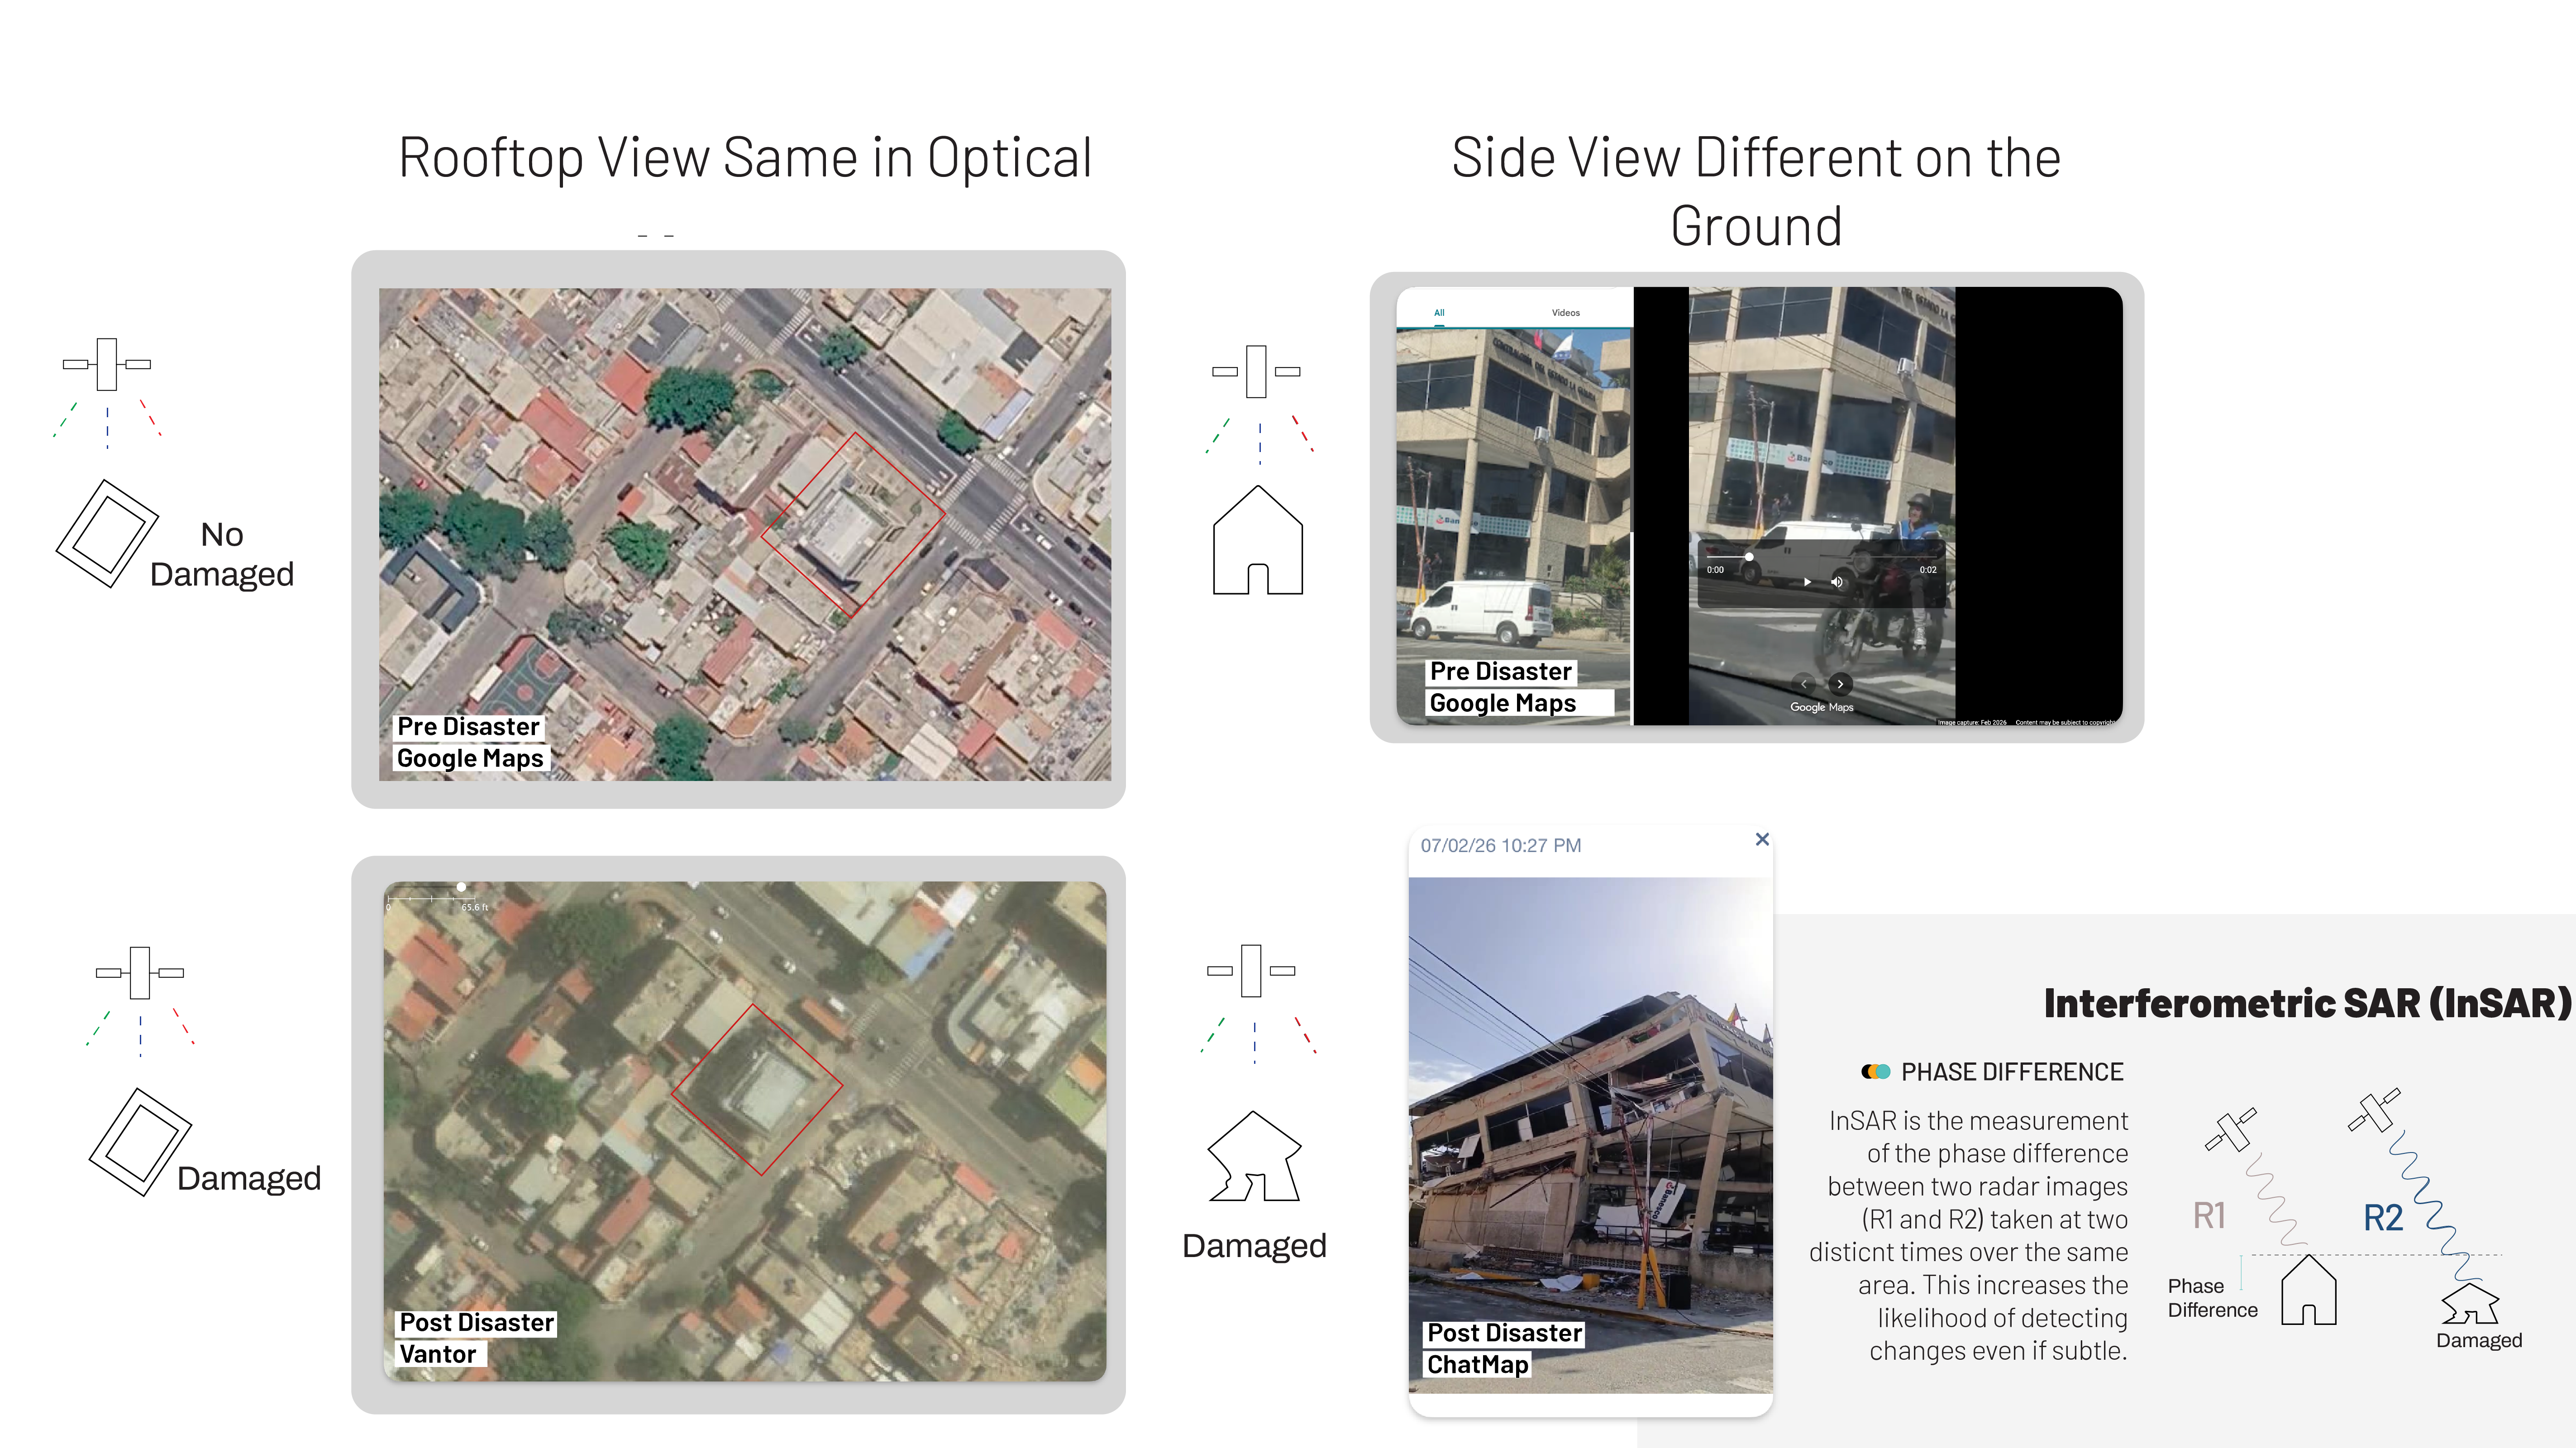
(fig.4) Comparison of satellite and streetlevel imagery of the same building, and how damage remains hidden due to the angle of the image.
In another analysis, researcher Corey Scher at Oregon State University identified a neighbourhood that was detected by SAR as damaged, but had no visible damage on aerial optical imagery. On closer inspection, it was determined by the irregular shadows post-earthquake that some buildings partially collapsed and were leaning to one side, but their roofs remained intact (fig. 5).
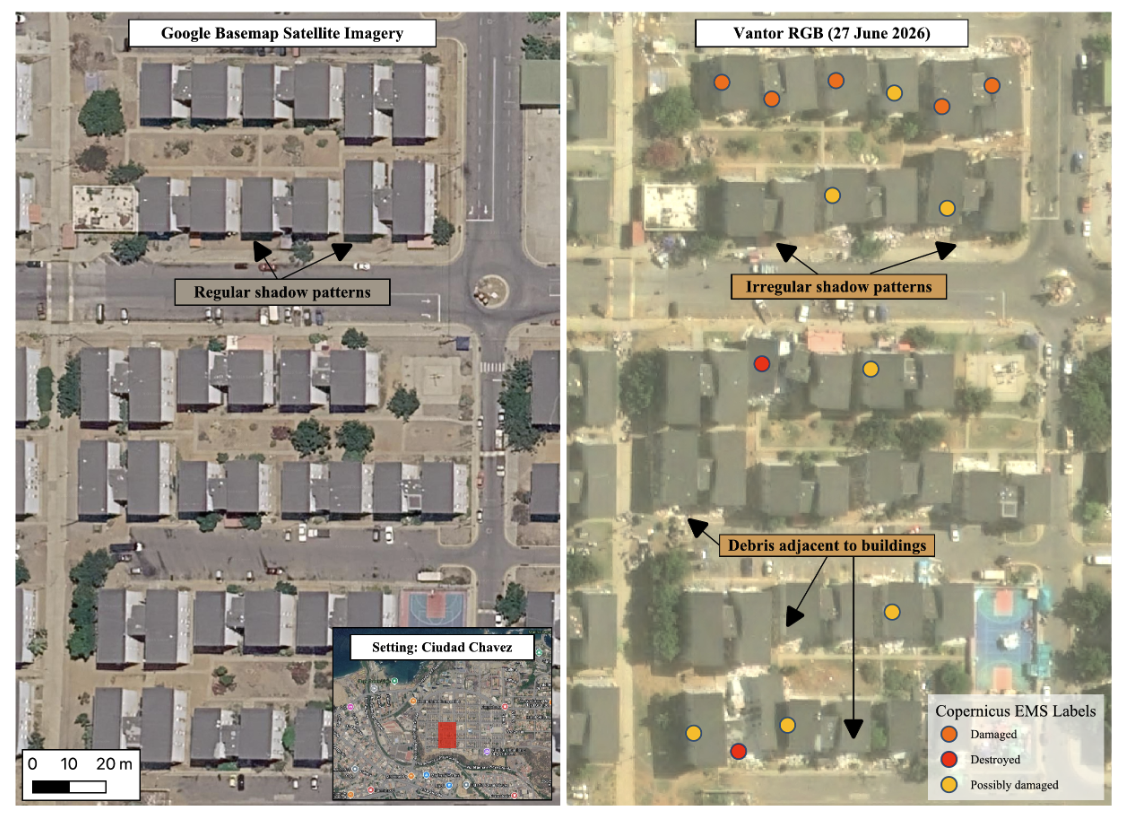
(fig. 5) Pre-earthquake imagery compared to post-earthquake. Colored points are Copernicus EMS damage grades. Irregular shadows and debris indicate damage but not identified by Optical Copernicus analysis.
Discussion on Optical vs SAR in an earthquake disaster
So, is one method or aerial imagery inherently “better” than the other? Not necessarily.
In an earthquake:
- Expect optical to primarily identify earthquake damage to roofs. Roof damage in an earthquake likely indicates severe damage or collapse. If you need an indicator of severely damaged buildings, optical is useful because it produces a less “noisy” dataset than SAR, but remember a building still might be collapsed with an intact roof.
- Expect SAR to identify a broader range of levels of earthquake damage, from minor cracks to full collapse.
- Use both or mixed methods together to identify hotspots of the most severe damage.
While there is no single source of truth in remote analysis, it is important to review multiple methods, understanding what each is showing, before drawing any conclusions.
Damage severity levels: As optical and SAR analyses capture different types of damage, levels of damage (minor to destroyed) would not be comparable across analyses and use cases. Defining levels of damage is best done on the ground, and specific to an operational use case that sets the definitions.
Timing: All damage assessments, especially rapid ones with little ground truthing are always going to be an estimation, and should be treated as such. As time goes on, more detail will come. At the time of this blog’s publication, earthquake activities and data needs in Venezuela are in an early recovery phase.
| Phase | Data Available | Data Need | Length |
|---|---|---|---|
| Response |
|
|
3-7 Days |
| Early Recovery |
|
|
1 week - 12 months |
| Long Term Recovery |
|
|
1-10 years |
Humanitarian OpenStreetMap Team’s Call to Action in Venezuela
Within hours of the earthquakes, HOT’s global community was responding - you can read more here. Volunteer OpenStreetMap contributors improved open building footprints to better understand the impacted areas and produce more accurate damage assessments. In less than a week, 451 people had mapped around 53,000 buildings.
HOT is also working with partners to use crowdsourcing and open AI to better understand the earthquake damage in Venezuela and we have the current initiatives:
- Remote earth observation: Using MapSwipe, volunteers are crowdsourcing optical imagery damage from HOT’s own tool (fAIr) and Microsoft’s assessment. The resulting dataset is human validated damage - where both AI and a human have detected damage visible on a roof in Venezuela.
- Ground truth: Since 30 June, community reporting through ChatMap has complemented satellite imagery and AI analysis with something only people on the ground can provide: firsthand information. Through WhatsApp, people inside Venezuela share their location, along with photos and videos of damage. ChatMap is now live for ground damage assessment of both buildings and roads, and runs through a deliberately filtered process. Reports come in through a public WhatsApp group open to anyone in an affected community, and a brigade of trained volunteers reviews and validates the information shared before it's added to the live public map.
Our damage mapping landscape Lebanon case study and user guide called for greater transparency and coordination, and that’s exactly what we’re seeing in Venezuela! The volume of data and coordination following this disaster is already informing responders, and the coordination and transparency amongst actors is not only really helpful now, but will also inform the next earthquake. The Global IMWG GIS group in July even had 7 organizations present on damage in Venezuela - contact data@hotosm.org for more information on that meeting.
The next time damage numbers cross your feed, the real question isn't which one is 'correct', it's what stage of response you're in, and what decision you're trying to make.
To get involved, check out HOT’s work on Venezuela or contact info@hotosm.org to support or partner in earthquake response and other humanitarian contexts.
Share