News — 03 April, 2019
An approach to field data collection in Kathmandu

Guest blog by Gaurav Thapa from Kathmandu Living Labs. Covering the collection process carried out by the team for surveying exposure data in Kathmandu Valley, Nepal as part of the METEOR project.
This blog is a continuation of the work described in the blog Kathmandu from above. Please check out the dedicated OSM wiki page for more details project.
Project
Kathmandu Living Labs (KLL) is working together with the Humanitarian OpenStreetMap Team (HOT) on the Modelling Exposure through Earth Observation Routines (METEOR) project. Our work is part of a larger collaboration between HOT, the British Geological Survey (BGS), ImageCat, and the UK Space Agency International Partnership Programme (IPP). This overall project is focused on developing innovative applications of earth observation (EO) technologies to improve understanding of exposure to help minimise risks from natural hazards. Our contribution to this project has been the digitization of building footprints and the subsequent building exposure survey of Kathmandu Valley. This blog describes how the building exposure survey was carried out by our team and the results of the survey.
Mapping Timeline
The field survey of the project entails building attribute data collection and took place from 1st January 2019 till 1st March 2019. The final phase of the project: field data validation, verification, and upload to OpenStreetMap (OSM) took place from 15th February 2019 till 15th March 2019.
Area of Interest
The project is limited to Kathmandu Valley, with seven homogeneous zones/development patterns identified by ImageCat. To know exactly where these areas are within the valley, please see: https://tasks.hotosm.org/project/5432 for a rough idea see the maps below.


Before going to the field
There were certain steps we had to take before beginning the data collection survey. First was to ascertain sample households. This was done by following the methodology developed by our partners at ImageCat. First, ImageCat remotely assessed the building structural characteristics of the urban areas of Kathmandu. Based on this they identified eight homogeneous zones/development patterns (going forward I will use these terms interchangeably).One of the development patterns - ‘rural’ was ignored for the purposes of this project, which left us with seven development patterns to work with.
Through ImageCat we were given a list of 53,000 randomized points covering all areas of Kathmandu Valley. We clipped these points along development pattern boundaries and got a smaller list of randomized points. To make sure that there is no bias we then sorted each of these lists by their randomly created unique identity (UID) numbers and settled on 40 randomized points per development pattern. Each of these points then acted as a reference around, which 10 households would be surveyed. After all the clipping, sorting and selecting we had a task of surveying approximately 2600 buildings. However, in reality several points fell under military/government complexes where ground survey is prohibited. In these cases, where possible alternative points were chosen and when not possible these points had to be ignored.
Recruitment of surveyors
For this project we primarily recruited recently graduated civil engineers with a sound understanding of building structures from the Himalaya College of Engineering, Kathmandu Engineering College, Universal Engineering College, Kantipur International College, Aryan School of Engineering and Sagarmatha Engineering College. We brought a local engineering consultancy firm, named Engineering Mantra, on-board to identify and recruit these surveyors. We recruited 12 engineers after a rigorous selection process.
 Image 1: Group interviews of potential surveyors
Surveyor training
 Image 2: First training of surveyors
A two-day training session was conducted by two senior civil engineers from engineering firm Resilient Structures. Resilient Structures, is a pioneering firm of Nepal, that focuses on minimizing potential risk factors of buildings that exist in any severe hazardous events. The first day the engineers from Resilient Structures provided details on building structures, materials commonly used in Nepal and challenges of visual inspection of buildings. Second day of the training session focused on the use of the data collection tools, OpenDataKit (OMK) and OpenMapKit (OMK), as well the process of field data collection and uploading to OSM. For this the surveyors were also taken out to the field where they collected real world data. This data was subsequently evaluated and feedback given to the surveyors.
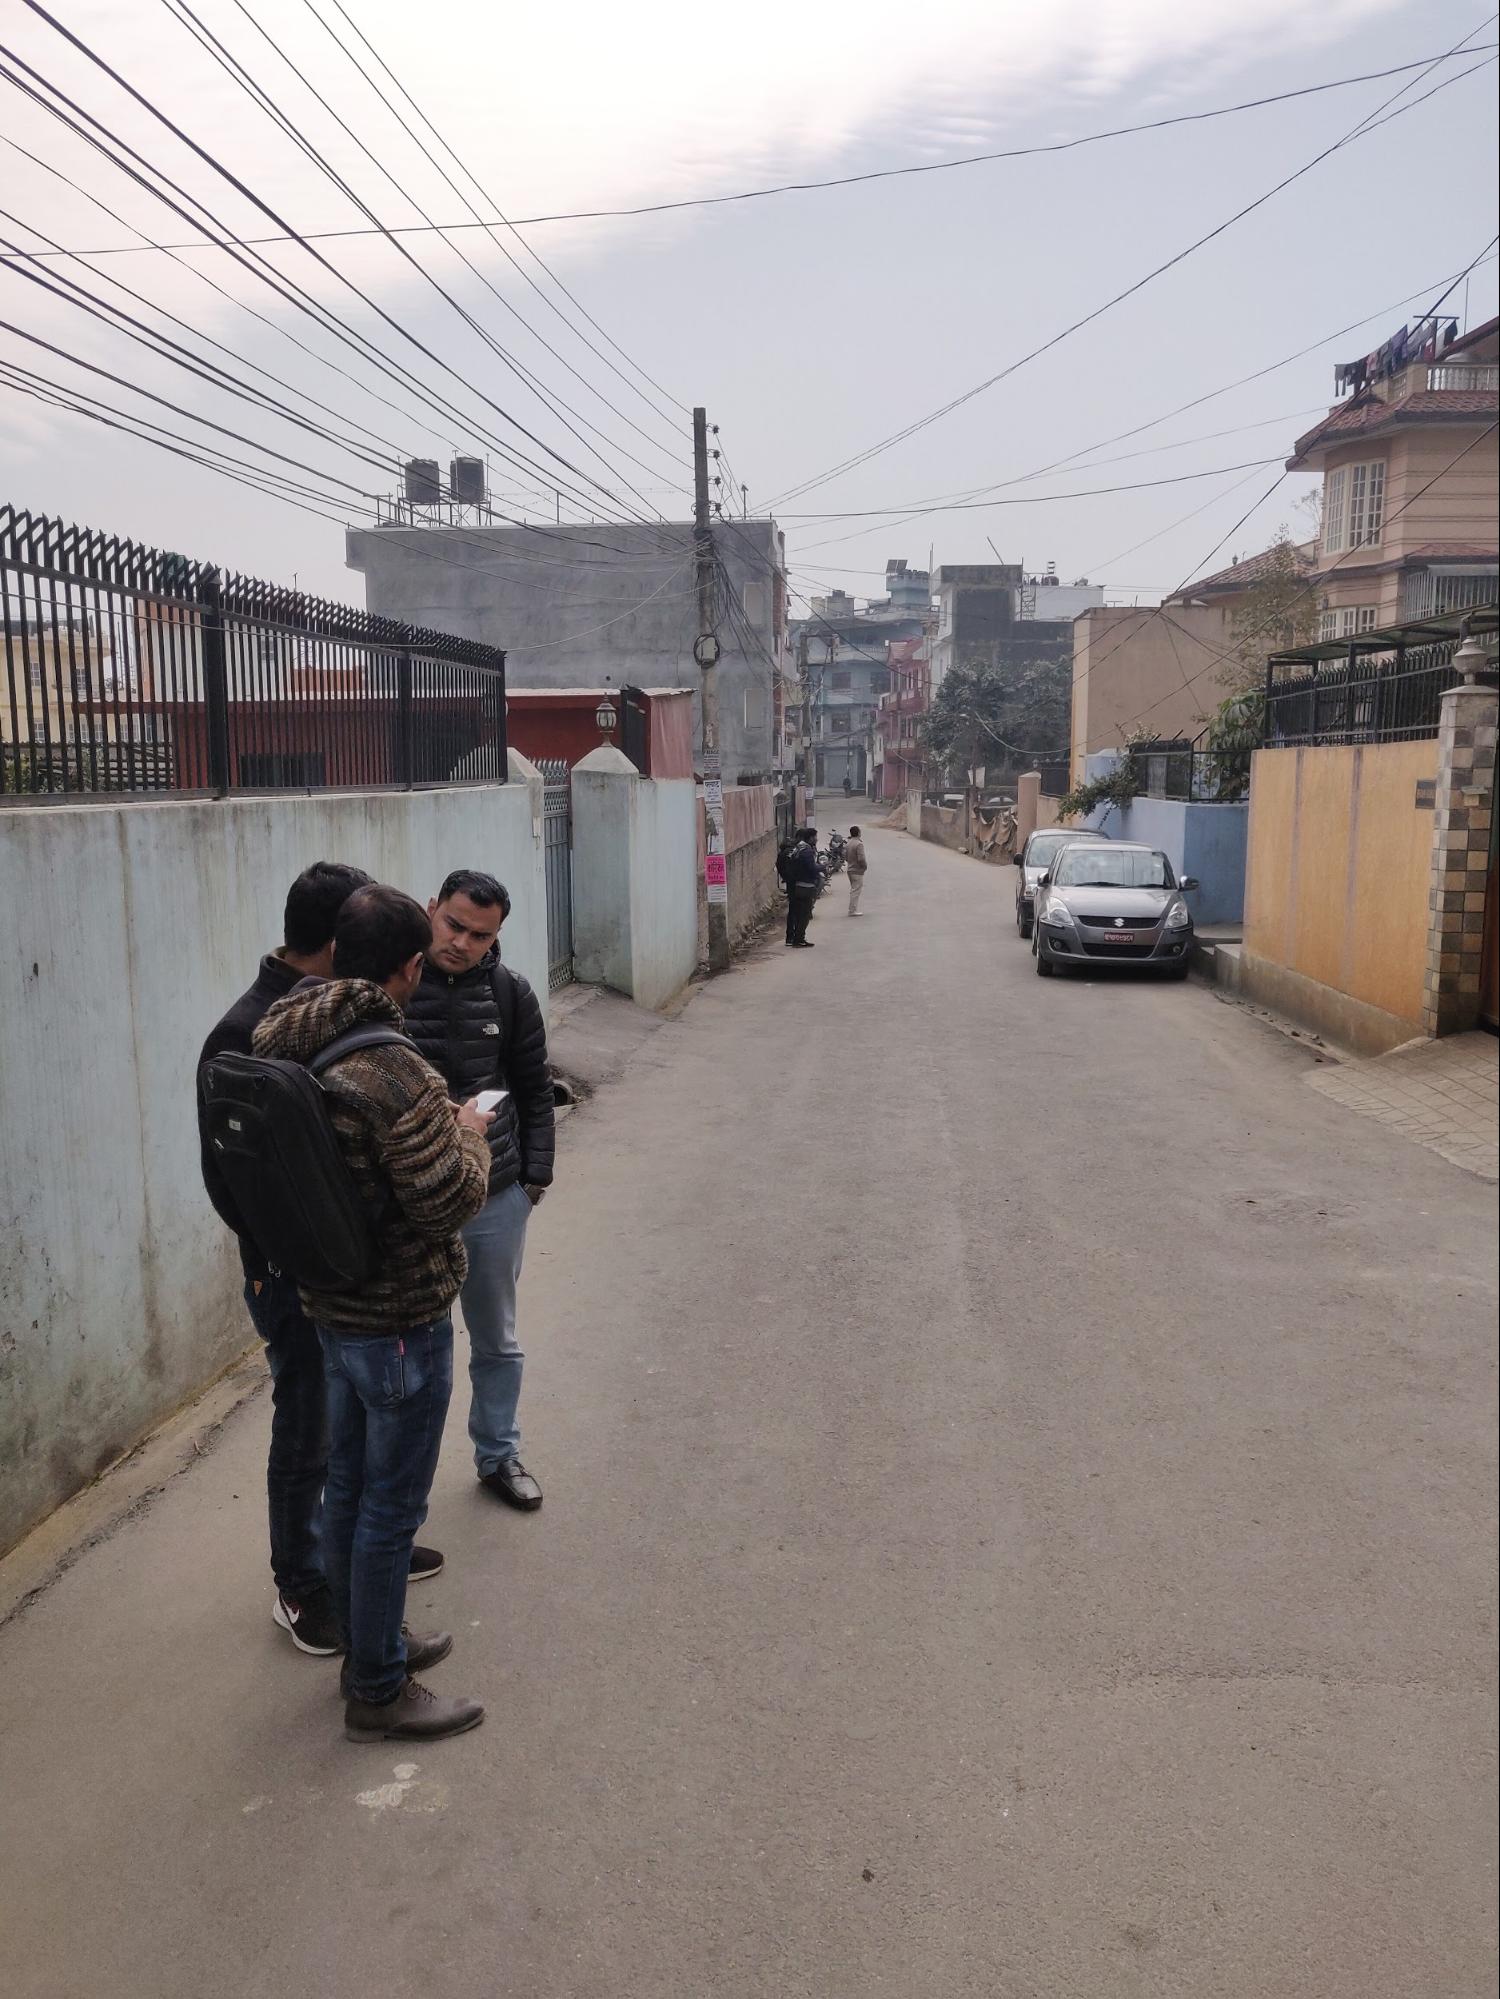 Image 3: Field training of surveyors (Chundevi, Kathmandu)
Before surveyors were sent out to the field, a map with all the randomized sample points was created. From local understanding of Kathmandu and its roads, six clusters were created. The clusters were digitised in QGIS and the total number of points each cluster contained were calculated and adjusted so that all six clusters contained between 45-55 points each. Based on these clusters six groups of two surveyors each was created. Groups that had longer travel times were assigned fewer points. Maps of the field areas were created and given to each group. The maps ensure that there are no overlapping field areas and thus prevents duplication of collected data.
 Image 4: Creating clusters for surveyor deployment
Additionally, surveyors were trained on the navigation app Maps.me. This application also uses OSM data and can be used while offline. A list of bookmarks was created for each group, where the bookmarks were the coordinates of the randomised points where the engineers conducted the surveying. 10 houses around each point was chosen and visually inspected by the surveyors. The field surveyors were given discretion on how far or near from the specific coordinate they can move. However, they were told not to infringe on the 20 metre buffer of another point. Surveyors were asked to ignore any point that fell inside military/restricted zones. Any surveyors encountering problems of not having access on the particular direction of a point were asked to collect data in a direction where possible.
Field Data Collection
Throughout the data collection period, weekly meetings were held. These in-person meetings were used as a place for surveyors to discuss the challenges they faced, ask specific technical questions to experts, learn more about OSM andOMK, while getting feedback on the quality of the data being collected.
 Image 5: Photographs collected of the same building to aid remote validation
Desk validations by our experts were conducted two times. Once when 50% of the data was collected and second time when 90% of the data was collected. To do this a .csv file of all survey groups were downloaded. These were then divided into six groups based on the individual name/device id through which the data was uploaded.
 Image 6: Weekly feedback session
Once sorted into groups, each tenth row was validated by experts based on the images gathered by the surveyors. This was done so that 10% of all data brought in is validated through desk research. After 100% of the data was collected, a peer desk validation was also conducted where surveyors went through each other’s data and left comments where they felt potential errors had been made, on a shared spreadsheet.
 Image 7: Desk validation being performed
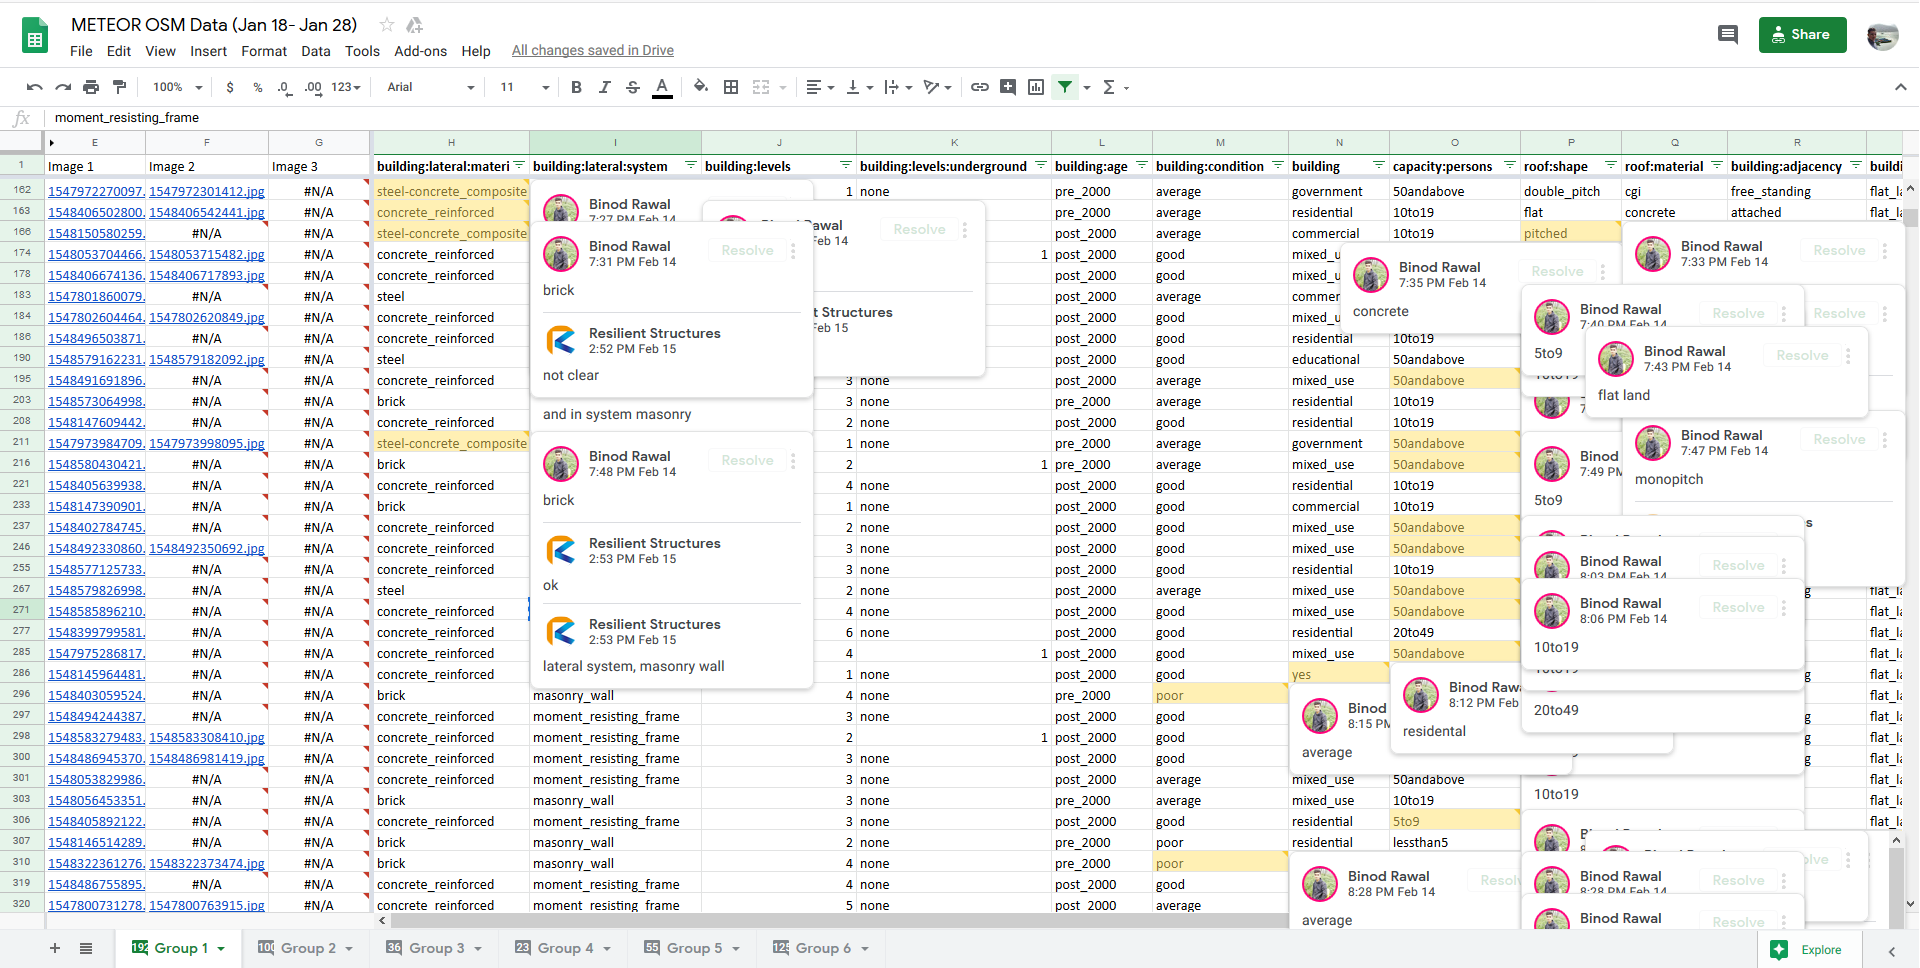

 Image 8: Peer evaluation spreadsheets
Further spot/field checking was also conducted. This was done once by the experts after around 50% of the data had been collected by the surveyors. Spot checking occured by taking the 10% data that had been validated through desk research out of which latitude and longitude of every tenth row was noted. These locations were then visited to ensure that data on the ground matched the images and data collected by field surveyors.
 Image 9: Spot checking of field data by expert
 Image 10: Spot checking of field data in highly dense areas
What did they collect?
The attributes collected were built upon the GED4ALL taxonomy developed as part of the GFDRR Challenge Fund. The ODK questionnaire contained the following building features and their attributes (see table below). Two civil engineering experts were brought in by KLL to localise the values. They were also able to tell us which building materials were more likely to be found within Kathmandu Valley and needed to be added as options. We hope that eventually such localized data will also help improve the vocabulary of OSM.
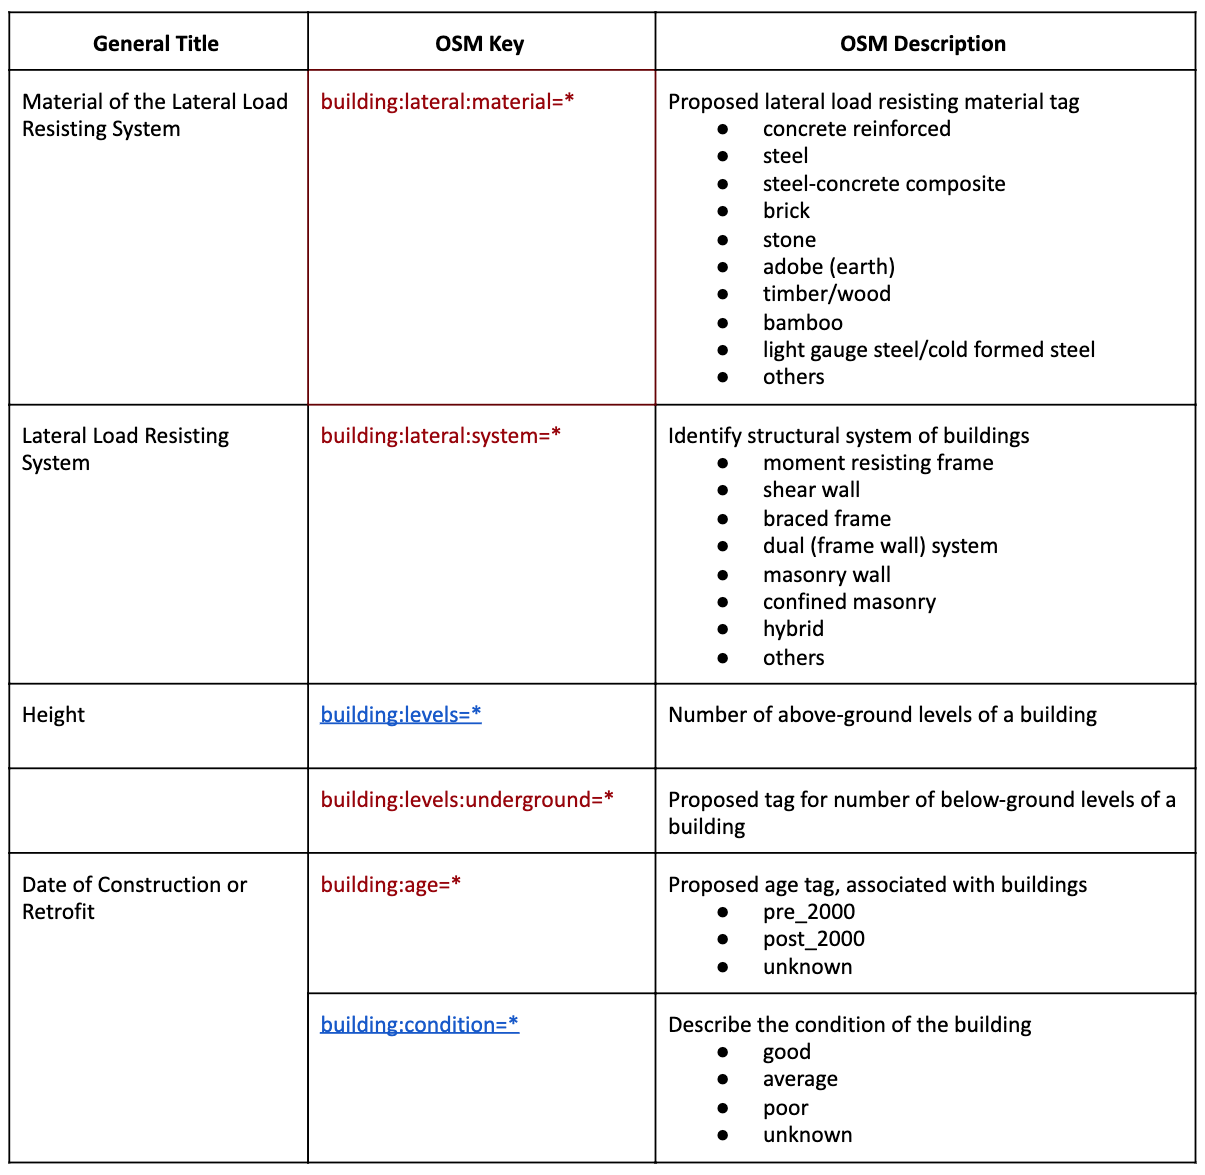
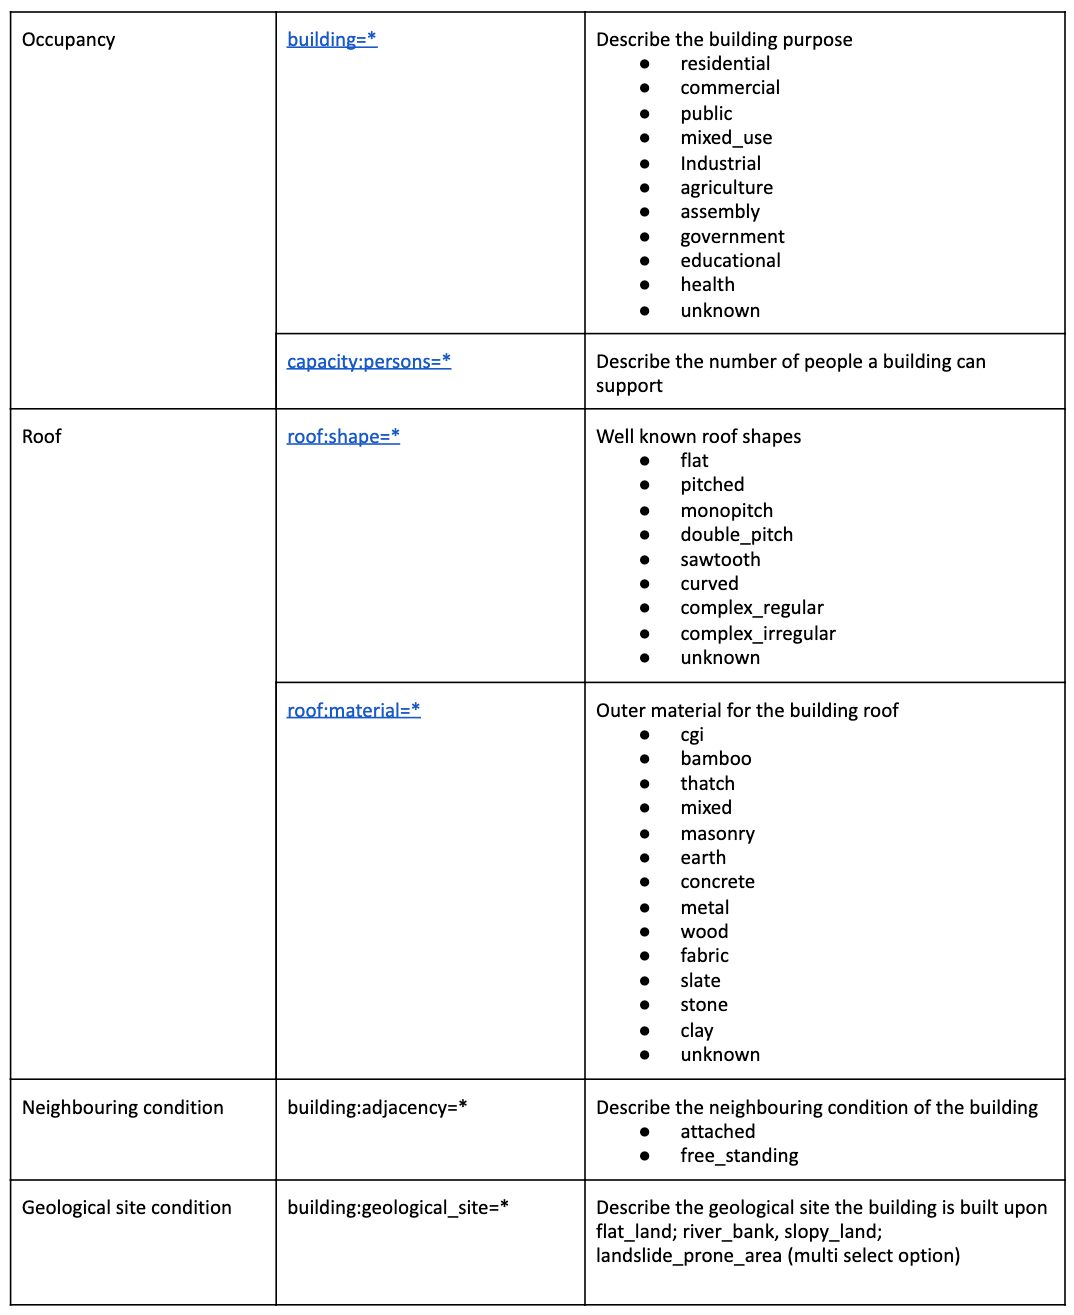
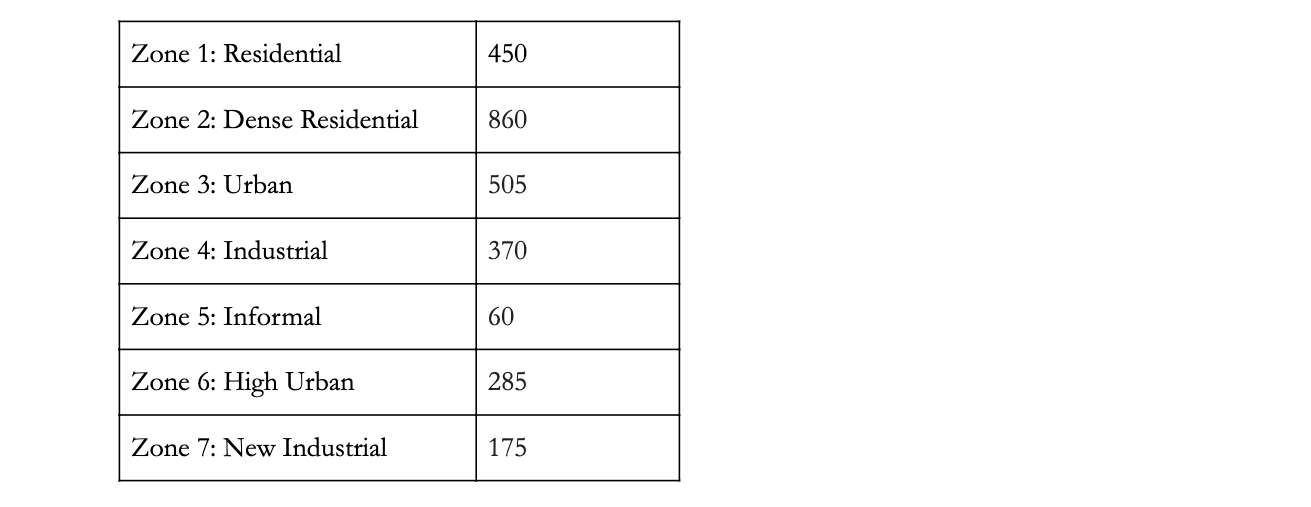
Finally, after four months of data collection, cleaning and upload 100% of the attribute listed above for 2,705 buildings (calculated by downloading all data containing unique source tag ‘METEOR Kathmandu Field Survey 2019’. Due to various difficulties on the ground and some zones being larger than others the breakdown by zone looked like this:
Future
Kathmandu Living Labs as a local organization plans to monitor and maintain the data uploaded to OSM. We are also hopeful that we will be able to improve the data utilizing tools such as Map Campaigner in the coming months. Each one of the surveyors were also trained on the basics of mapping and in addition at the end of each survey form a ‘fixme=*’ tag was kept. This tag was used to describe any mapping errors discovered by the surveyors on the ground. Some examples could be “north side of the building is attached to a neighbouring wall” or “the building complex is actually 4 separate buildings evenly divided”. This tag has been specifically included to maximize the improvement of OSM. It has also made it easier for the OSM Nepal community to continue improving OSM beyond the project period.

