Collecting building data sets for exposure data in Tanzania
Posted by Emmanuel Kombe, Hawa Adinani • June 27, 2019

Since 2018, HOT-Tanzania has been carrying out the METEOR project, a project that uses Earth Observation (EO) data to assess the level of exposure – the situation of people, infrastructure, housing, production capacities and other tangible human assets located in hazard-prone areas – and improve disaster risk management efforts. Natural hazards are becoming more dangerous, mainly due to the increase in exposure faced by people and infrastructure. Add to that one billion new buildings estimated to be constructed by 2050, and the level of risk increases even more (according to UNDP-Human Development Report-2016).
How can data produced by the METEOR project be used to develop a model for measuring exposure of people and infrastructure to risk? We explore how the project in Tanzania has already been developed, walking through how we collected field data, our methodology and how the data will be used.
What is METEOR?
METEOR is being implemented in two pilot countries-Nepal and Tanzania. The project will test and validate the process of producing and utilising exposure data. By co-designing results internationally, it will help improve response to hazards and promote the welfare and economic development of the country in which it is implemented. Country-wide, openly-available exposure data will be rolled out for the 48 least developed countries who receive official development assistance (ODA), with the following objectives:
-
Increase the resilience of Nepal and Tanzania to natural hazards through the integration of robust and open building exposure data derived from satellite data.
-
Improve capacity for stakeholders in the use of exposure data in Disaster Risk Reduction (DRR) and Disaster Risk Management in Nepal and Tanzania.
-
Deliver robust and open protocols for exposure development.
-
Deliver open-source, national-scale building exposure data for all 48 countries on the list of least developed ODA recipients.
-
Directly contribute to UN Sustainable Development Goals and Sendai Framework for Disaster Risk Reduction by improving resilience and adaptive capacity to hazards and substantially increasing the availability of and access to disaster risk information.
How did we collect the data?
In a previous blog, we explored the initial stage of METEOR and how the surveyed data on OpenStreetMap will be tested along with country-wide datasets developed by ImageCat, a provider of risk and disaster management technologies. The testing enables us to see if the data is suitable to be used by randomly selecting buildings from the same patterns in established homogeneous zones (e.g. sample polygons from the same zone, such as urban), then validating two focus areas to ensure they are fit-for-purpose.
For the digitization process, which involved identifying and mapping houses remotely from aerial imagery, mappers digitized more than 10,955 buildings from selected homogeneous zones. A team of 20 field mappers were trained on data collection and the type of data that needed to be collected, then were sent out to conduct a ground survey. Data was collected in selected homogeneous zones based on five categories:
-
High urban development zone
-
Industrial zone
-
Urban development zone
-
Single-family residential zone
-
Rural settlement
-
Natural forest land
-
Informal settlement zone
For each homogeneous zone, buildings were systematically randomised to identify sample areas for data collection. Details were mostly based on the material of the building, as one of the aims is to assess how resistant the building materials are, in case of being hit by a disaster. The team used OpenMapKit to select building features on a prepared map layer and then used OpenDataKit to add details about buildings.
The attributes were built upon GED4ALL and we adapted a data model from the Kathmandu project, involving a structural engineer to localise the model to cope with the Tanzanian context and fit with local buildings. Here are some examples of the categorisations:

Map Campaigner
To monitor attributes completeness, we ran them through Map Campaigner. Below are examples of the campaigns we ran:
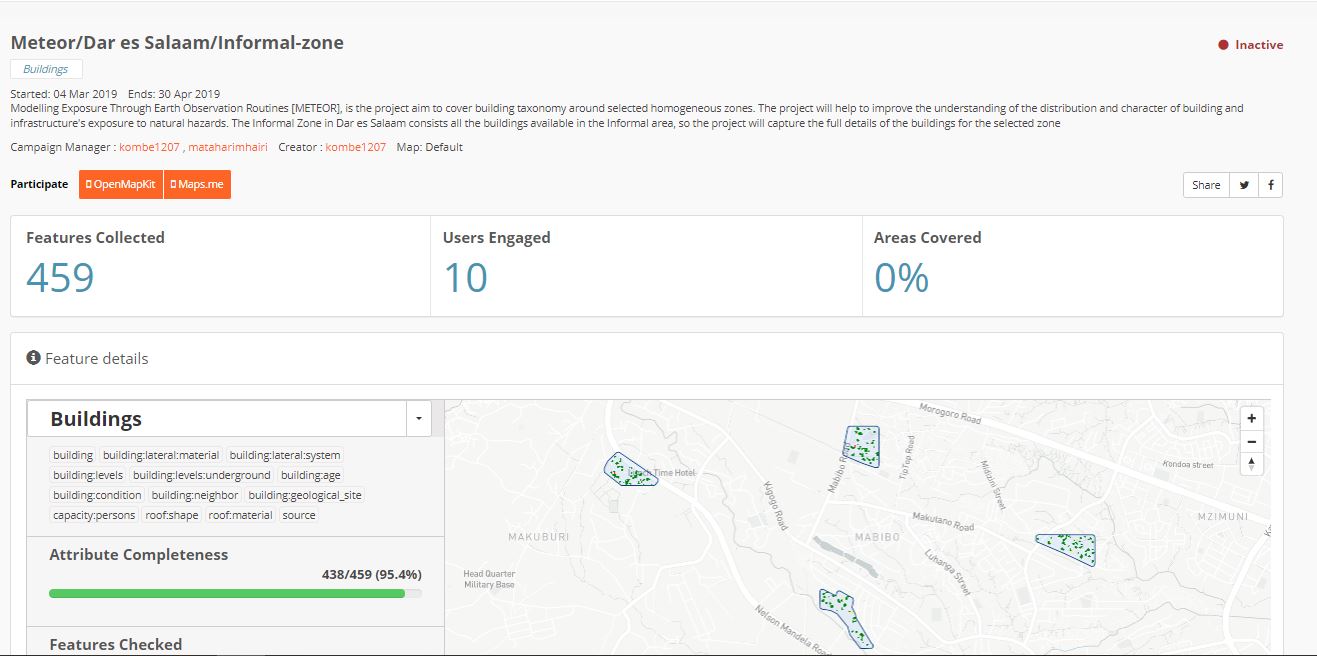 A screenshot of a campaign that covers an informal zone
After field collection, the data was then validated by a group of experienced mappers and cleaned through QGIS and JOSM software to see if there were any missing pieces of information. Next, the datasets were shared with ImageCat, who will use them to create additional exposure datasets at various levels for the country, and can be used for disaster risk assessments. For example, in Tanzania, this increases the availability of, and access to, exposure information, which when combined with hazard and vulnerability information, will better inform risk assessments.
Challenges faced during data collection
-
Some sample buildings were not found during field mapping, a number were demolished and others had changed use. In cases like this, it was replaced with another sample.
-
Mappers faced restrictions and inaccessibility to some buildings samples, e.g. National Intelligence premises, a military base and fenced houses.
-
Inaccessible roads meant mappers had to use alternative transport, such as motorbikes, which were more costly.
-
Map campaigns had to be created to monitor attributes completeness. We encountered technical difficulties as only closer polygons were allowed within one campaign, therefore, distant polygons caused a failure of rendering all the buildings. After flagging the problem to the HOT technical team, they solved the issue and now map campaigns can be created even though there are more scattered polygons to fit in a single Map Campaigner.
Share