Mapping as a response to the disaster in Esmeraldas, Ecuador
Posted by Juan Melo Luna, Juan Arellano Valdivia • July 25, 2023
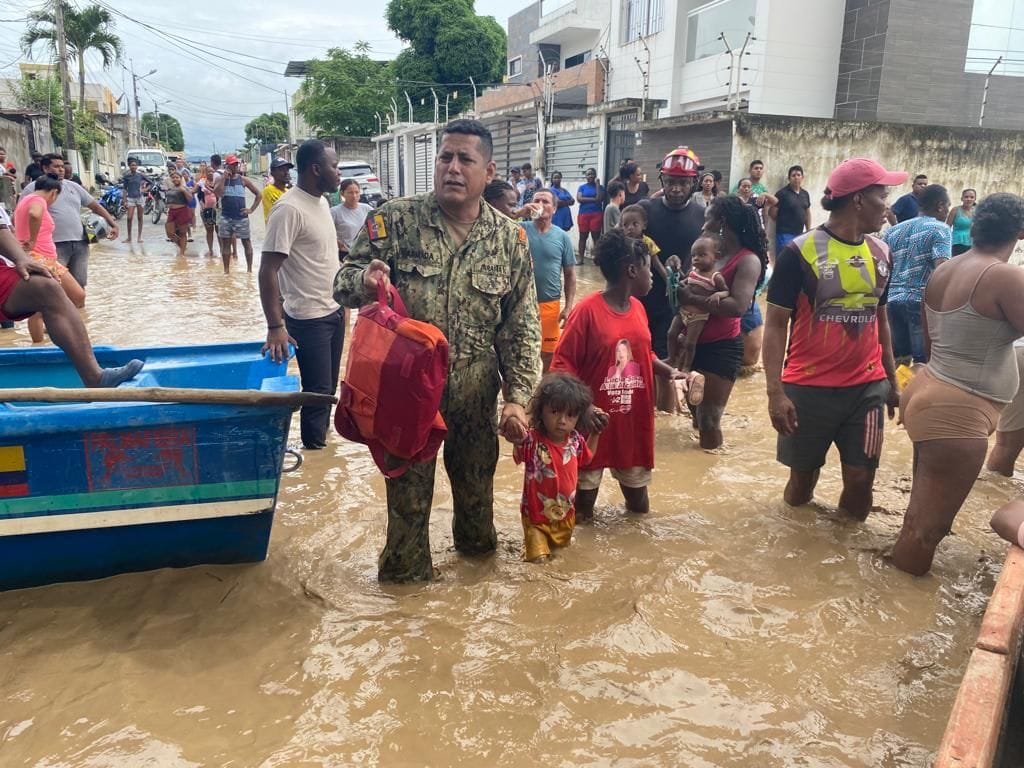
The LAC Open Mapping Hub supported the response efforts to the disaster caused by the floods in Esmeraldas, Ecuador in coordination with the Ecuadorian Risk Management Secretariat.
At the beginning of June, the province of Esmeraldas in Ecuador was affected by intense rains that caused the overflow of six rivers in the region and caused approximately 20,000 people to be affected, according to the Secretariat of Risk Management of Ecuador.
In the days that followed, aid activities developed, and several members of the Ecuadorian mapping and humanitarian community -including officials from the Ecuadorian Risk Management Secretariat- contacted the Open Mapping Hub of Latin America and the Caribbean to coordinate mapping actions, for which we generated a "disaster response" for the Esmeraldas area.
Methodology used in the “disaster response” for floods, Esmeraldas, Ecuador
Basically, the disaster response consists of a series of actions that we take to be able to help the populations and/or organizations that request it when they face a disaster. This ranges from analyzing the state of the map at that moment to summoning networks of volunteer mappers to carry out the necessary mapping tasks.
In the case of Esmeraldas, it was decided to generate specific projects through HOT's “Tasking Manager” tool for an immediate response. The first step consisted in defining the areas of interest for the projects: the input data provided by the Ecuadorian authorities were:
-
the point layer with the sites where the emergency (flood) occurred
-
the region's flood susceptibility layer
-
the layer with the parishes affected by the emergency

- Flooding points in Esmeraldas - Susceptibility map of the region - Affected Parishes
In order to determine the priority areas that require more attention from the authorities and that need an updated cartography, the largest number of variables were analyzed that would allow a clearer concept of the areas that could be at risk.In this sense, three main elements were determined;the proximity to flooding points, the proximity to populated centers and the degree of susceptibility to flooding.

Populated centers of the region
Taking the three previously mentioned variables as a reference, we proceeded to:
-
Carry out a multi-criteria analysis with the help of GIS tools
-
Generate proximity layers to know the areas closest to flood points and populated centers
-
Determine the areas in which the three variables intervened critically.

Defined areas for projects within the TM
These areas were the ones that were finally used to create the mapping tasks in the Tasking Manager, which was carried out in a prioritized manner, ending up with a total of 10 mapping projects.
With the first group of tasks ready to be worked on as of June 8, we began to spread them through our social networks. (Instagram, Twitter, Facebook) summoning mappers and validators from all over the world to collaborate with the mapping for Esmeraldas.

Results obtained so far
Being 45 days after the emergency mapping work began, these are the results in what corresponds to the ten projects created:

In summary, by mid-July, seven of the ten projects were already 100% complete for a total project progress of 92% (mapping and validation).Up to now, 498 kilometers of roads and 25,765 buildings have been mapped.
The Risk Information Management Director of the Ecuadorian Risk Management Secretariat, Eng. Oswaldo J. Cárdenas, told us that: "The data added to the map was very useful for our management, since we used the map of OpenStreetMap as the base map in all the geographic applications that we handle, speaking specifically of the Esmeraldas area, there is a geographic viewer that is centered on the area that you surveyed. This viewer has been used for the management of Provincial and Cantonal EOCs (Emergency Operations Committee) and collection of information from EVIN (Initial Assessment of Needs)."
It should be noted that although this methodology used information from the phenomenon presented in Esmeraldas - Ecuador, it can give ideas about how to effectively select the work areas for projects related to emergency response that occur in other regions of the world.
In fact, in a context of global climate change and with a present El Niño phenomenon, mapping as a tool in risk management and disaster response becomes totally necessary and essential in the strategies to be implemented by local and national governments.
After this collaboration, the Ecuadorian Risk Secretariat and the LAC Open Mapping Hub are preparing to establish stable lines of collaboration that allow training the local population in mapping techniques in areas at risk, increase the quality and quantity of data in open and available formats, and improve response capacity in Ecuador.
In this sense, the Open Mapping Hub is open and willing to collaborate with other risk management offices in emergency response, preparation, training, and the establishment of a geospatial support network in the Latin American and Caribbean region.
If you want to be part of the community of volunteer mappers of the LAC Open Mapping Hub, write an email to hublatam@hotosm.org with Subject: Volunteer mapper. If you are part of an organization that wants to explore how to collaborate on a project, write an email with Subject: LAC Projects.
Follow us on networks: TikTok, Twitter, Mastodon, Instagram, YouTube, Facebook, Linkedin.
The featured image of this post was taken from the Ecuadorian Navy Facebook account.
Share