News — 13 May, 2024
Training Open Mapping Tech for Wildfires in Córdoba, Argentina: Workshop in Unión de Los Ríos
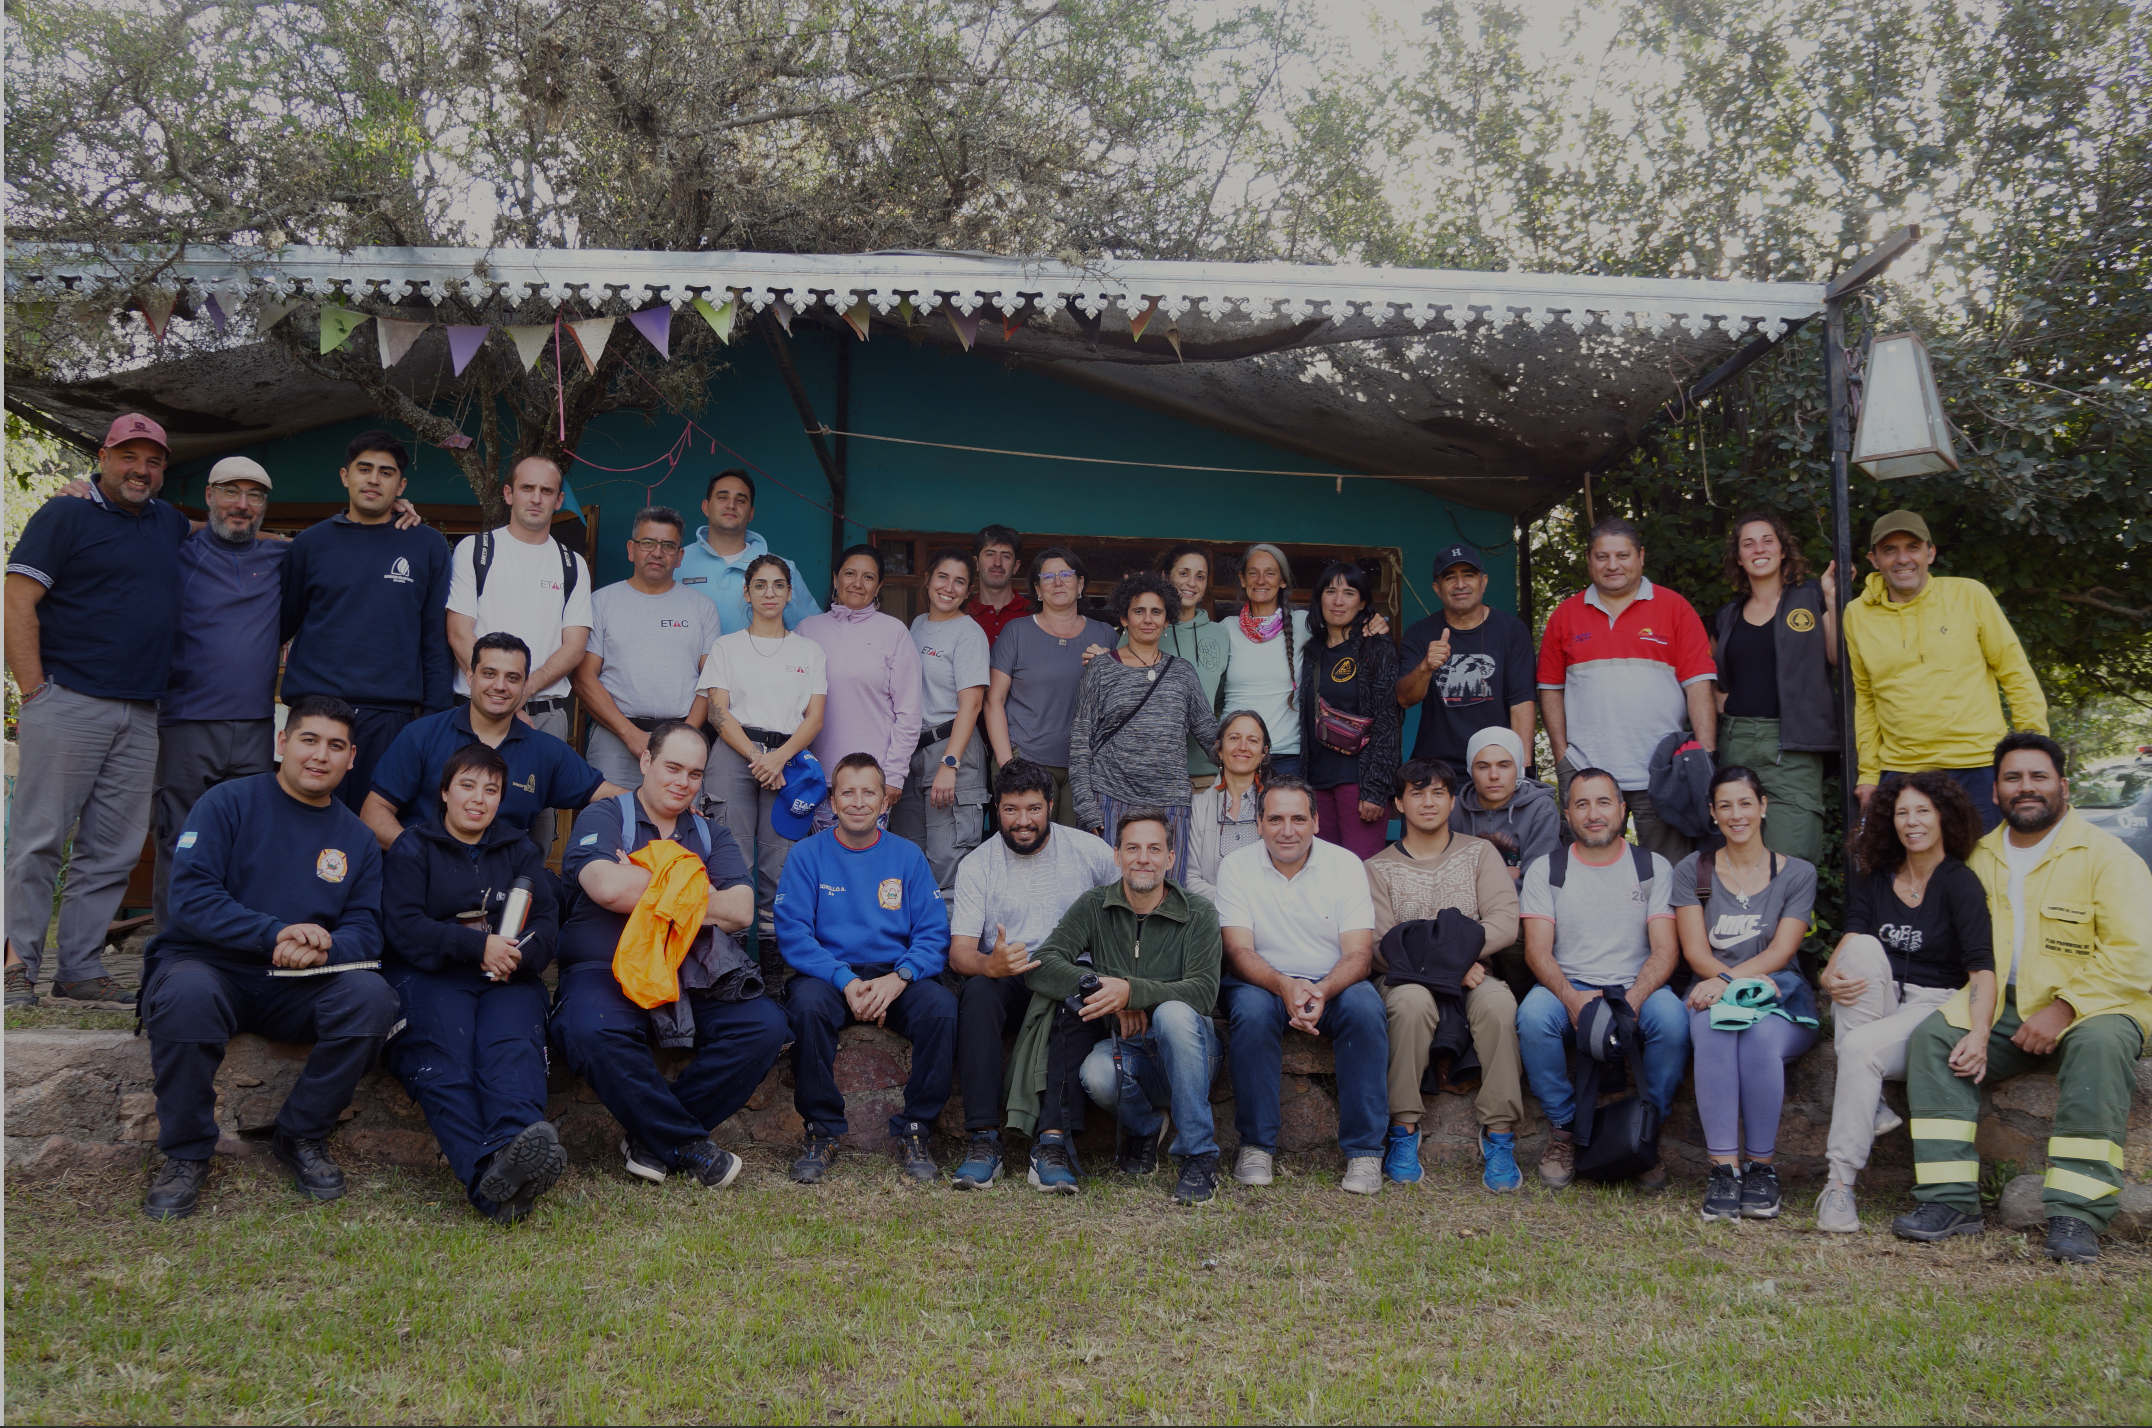
On April 1 2024, we did a workshop called “Open Mapping for Inclusive and Sustainable Development. Mapping Tech in Wildland Areas: Forest Fires Edition” in Unión de Los Ríos, Córdoba, Argentina.
The workshop was part of an activity organized by the Río Cuarto National University and CONICET (National Scientific and Technical Research Council), together with local organizations. Unión de los Ríos is a small rural town affected by forest fires, where the university possesses land inhabited by some families. Daniel Bellomo, who works at the university and runs projects with communities in the town, was key to attendance.
More than 40 people participated in this workshop, both in the organization as well as being facilitators and learners, including Volunteer Firefighters, ETAC (Technical Team for Disaster Action), Local Cooperative Utility Company, National Parks Administration, Rescue Crews, drone users, community leaders, and neighbors.
Part 1: Preparation
Before the workshop, we did a couple of preparation activities to prepare material for use during the workshop.
The Territory
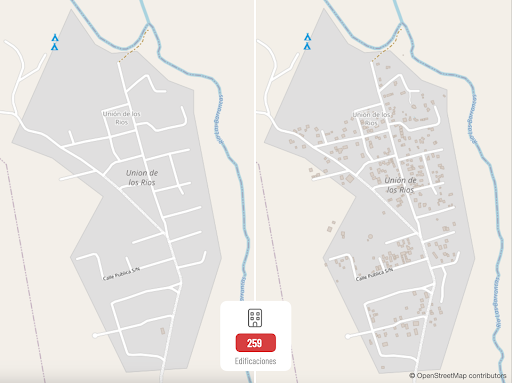
The map for Unión de los Ríos was really poor, with only some roads and one building mapped. We ran a quick mapathon with four people where we mapped most of the buildings of the small rural town.
The Disaster
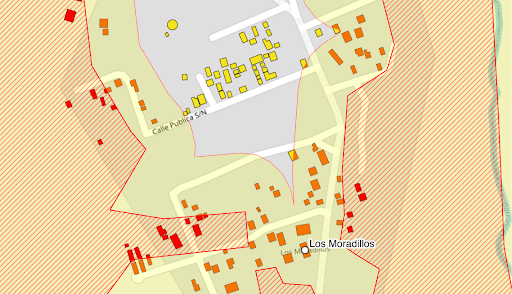
This activity was aimed at one specific kind of disaster: wildfires. Knowing that a previous fire was very close to this town a few years ago and taking my experience working on these situations, I created a map:
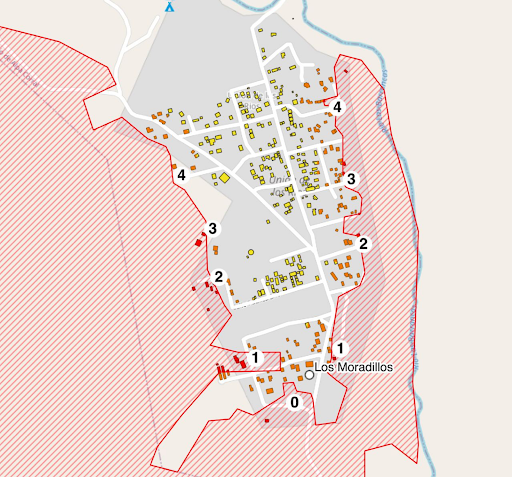
This map shows the area affected by the fire over a map of the town with all buildings, highlighting the ones that were inside or very close to the burned area, most of them in what we call the WUI (wildland-urban interface). The point with the label “Los Moradillos” is the place where we ran the workshop. The numbers are points of interest for our field activity during the evening.
How was this map made?
1. Search the news
I searched in the news for recent forest fires around this town, and I found that in November 2020, at the same time we were fighting weeks-long fires here in the north of the province, people in the south were having their own big fire.
2. Draw a polygon from satellite imagery
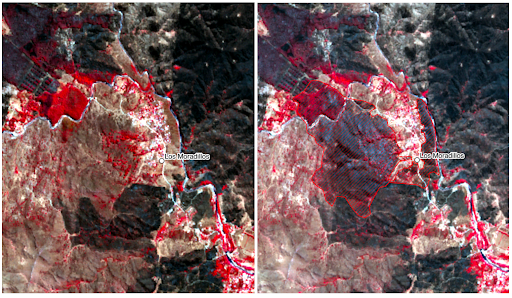
I downloaded images from the Sentinel satellite (using the Sentinel Hub EO Browser for the dates of the disaster, using the “false color” band combination that highlights healthy vegetation in red and burned areas in black. Then, I imported these images into QGIS.
After identifying the area that burnt around the town in just one day, I drew the polygon marked in red. I did this manually this time because the area was small, and I did not require too much precision. For more complex cases, I used a tool for detecting the difference between two satellite images:
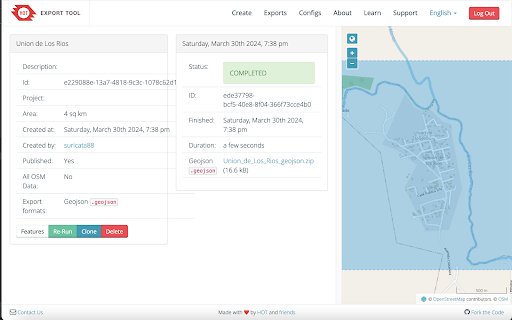
3. Download mapped geometries
With the polygon of the burned area as the Area of Interest, I downloaded the building geometries we’d mapped before using the HOT Export Tool. I also exported roads to improve the map design.
4. Build the map
Finally, I imported all data into QGIS, created a buffered version of the burnt area polygon, and intersected the fire polygons with the buildings, resulting in the highlighted buildings that were at moderate or high risk during the fire.
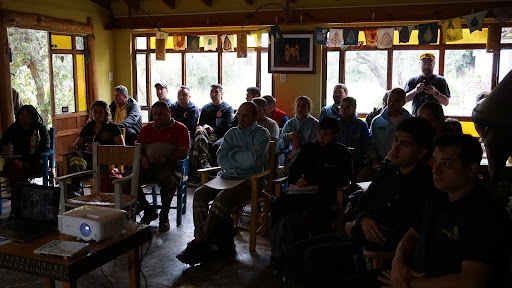
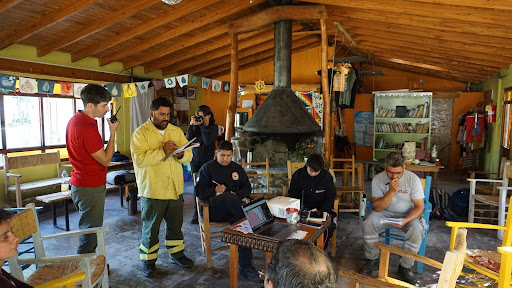
Part 2: Presentations
For the presentation, we had two speakers and one facilitator.
The facilitator’s work was important because it kept the schedule on track, enabled questions from the participants, took notes, and made the activity much more fun.
I’ve started talking about my work as a volunteer firefighter specializing in wildfires and how we’ve started using OpenStreetMap at the fire station and with community fire crews. Then, I made the connection between that work and the HOT Tech & Data Team, showing examples of how the Tasking Manager, OpenAerialMap, and Export Tool can be used before, during, and after wildfires. I closed my presentation by talking about the tools that we’ve asked to use during the afternoon fieldwork: OsmAnd and uMap.
The second speaker was Cesar Dapía, a fellow volunteer firefighter with extensive experience in forest fires. We’ve been using open mapping tools together, like OpenStreetMap, QGIS, OsmAnd, and uMap, for more than 6+ years. He talked about how we’ve started using open mapping tech in wildfires, told stories about it, and highlighted the benefits of using these tools over others, like Google Earth. His presentation was the key to keeping non-technical people interested.
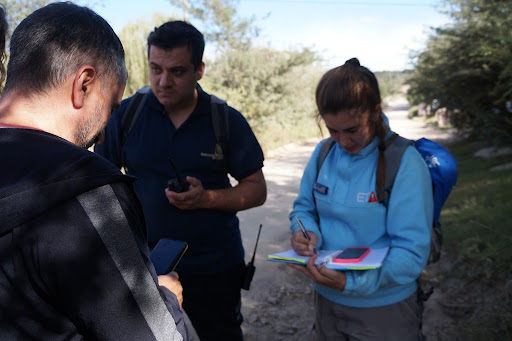
Part 3: Fieldwork
The activities realized during fieldwork are really important during operations in remote areas because of their wide accessibility. The only things that are needed are cheap VHF radios and smartphones instead of an expensive system with digital radios, like the ones used in big institutions. Another important characteristic is resilience, as this kind of system is really strong against lack of power or connectivity and can be easily deployed. We’ve been using this strategy all the time during wildfires to share coordinates between crews with the Incident Command and to navigate to and within the fire. Along with a complete map and up-to-date aerial imagery, it can be even more powerful.
Preparation
We presented the maps we’d prepared for the fieldwork activity: “The territory” and “The disaster,” and the activity: a wildfire drill about a real fire that happened three years ago.
People prepared their smartphones by installing OsmAnd and downloading offline maps. We also did a quick review on
- How to use OsmAnd for offline navigation, by tracks and roads or in the open field
- How to know the coordinates of their current position
- How to share the coordinates by instant messaging and by VHF radio
- How to write a received coordinate and navigate to it
- How to record GPS tracks and POIs
VHF radios were used for fail-safe communications, as we usually do in real disasters.
Then, we’ve formed different groups of people:
- Fire Crews - 4 groups of ~6 people each. They had smartphones with OsmAnd, offline maps, and at least 1 VHF radio.
- Incident Command - 1 group of people that were fixed in one place, with computers, internet connectivity, radios, and paper notebooks.
Goals
1.Navigation + Operations Monitoring
We told all crews to be outside and wait for instructions. Then we shared, by VHF radio, the coordinates of different pre-established points with each crew, asking them to mobilize to that position.
As the crews started moving to the assigned coordinates, we at the Incident Command created a map in uMap, uploading the polygon of the fire in GeoJSON format and adding a few points to it. This map was shared between different members of the Incident Command:
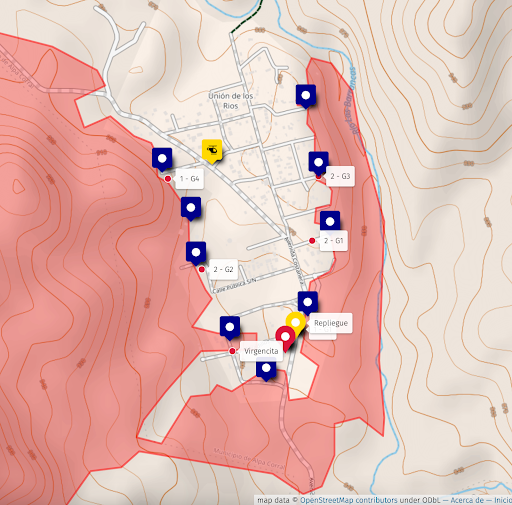
2. Sharing Location
As the crews reached the designated points, we asked them to share their coordinates to confirm their location on the map, as sometimes the crews were not able to reach the exact position because the vegetation was too dense, the access was private, or some other cause.
3. Field Survey
We continued mobilizing people, giving them new coordinates, and asking for their position and the position of the other crews. They also shared some observations, like a good place for a heliport and some POIs that could be added later to OSM.
4. Back to the Incident Command + Information Sharing
We asked crews to abort the mission because of a supposedly dangerous situation. They returned to the Incident Command, where they shared the information collected in the field.
5. Analysis
We showed the map we’d created at the Incident Command, analyzed it together, and gave feedback about the activity.
Event Closing
The event closed by giving thanks to all the people who participated and asking them to fill out a survey to give them certificates of participation later.
Conclusion
This workshop provided people with knowledge, maps and contacts to be better prepared against wildfires and other disaster events that are on the raise, fueled by the climate crisis. As it was proven again and again, and I can talk about this from my personal experience, free and open tech and data are the keys to continuing to develop solutions for everyone, regardless of the place of the world where they live. HOT Tech & Data tools, used in combination with shared knowledge and experience, are an invaluable asset for people around the world. There are a lot of opportunities for improving our products and services, as well as creating an end-to-end solution that will be useful for technical and non-technical people, official institutions, and communities.
Ideas and Next Steps
This workshop was an experiment to learn about the possibilities of combining HOT tech with existing practices of using open mapping tech and data in disasters like wildfires. The proposal is to continue doing more workshops, both to learn about how to improve our solution and to share knowledge about existing tools that improve the work of people on the first line of climate change. As my experience and knowledge are focused on wildfires, I’ll provide examples about those, but the same strategies can be used during other disasters, something that I’ll be exploring in the future.