News — 22 September, 2022
Working together for better OSM data quality

What we learned at State of the Map 2022
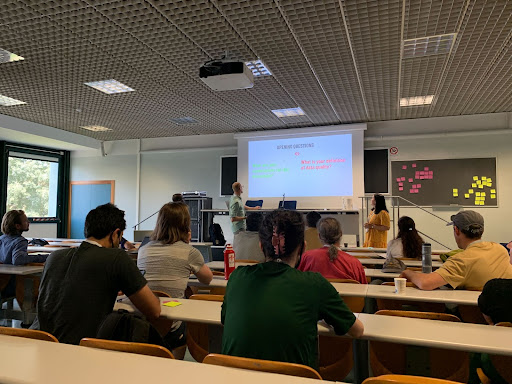
At State of the Map in Florence, HOT’s Data team, in collaboration with our Tech team, members of the Quality Assurance & Control working group, Training working group, and HeiGIT, organized several sessions focusing on identifying and addressing data quality issues in OpenStreetMap (OSM). The data quality discussion session was attended by 30 participants, representing diverse interests and organizations.
The first question we asked the group was to “define data quality” from their perspective in order to understand and to set expectations of the session. The responses in the workshop can roughly be grouped according to four themes:
- Data can be “trusted”
- Data should be “fit for purpose”
- Good enough quality and completeness of data
- Data and geometry features conform to certain technical requirements
These raise a number of follow up questions:
- What does it mean for data to be “fit for purpose”? How do we decide on the purpose of data, and the most urgent and important data uses it needs to be able to satisfy?
- How can we quantify trust in data, and what does this depend on?
- What aspects of quality, such as completeness or positional accuracy, are we prioritizing? Are all datasets equally valuable - and how do we choose among those?
- What data uses really depend on correct geometry and tagging, and which aspects do we need to address most urgently?
OSM data needs to be fit for purpose
From our side, the definition the Data team has been using to structure its work is that OSM data has to be fit for purpose; it must be able to address and inform the most important and impactful use cases and decision making to aid our (humanitarian) partners and communities’ use of maps and data. What constitutes “good enough” data depends on the context and immediate use cases that the data is being requested for.
For example, consider how different the data needs look in two sudden onset disasters such as cyclone Idai in Mozambique or humanitarian response for refugee movements such as the South Sudanese civil war. Programs where data is used for rural development focusing on rural electrification and financial inclusion, or urban planning with a specific focus on public transport and flood resilience.
A large community of researchers has already analyzed the quality of OSM data. The work of Senaratne et al. (2015) provides a good overview. It has been acknowledged that OSM data in general is strongly biased, in part due to a much larger contributor basis in countries in the global North as a consequence of socio-economic inequalities and the digital divide.
The HeiGIT team at Heidelberg University has addressed OSM data quality questions in research projects over the past years, e.g. to for land use and land cover, and others have investigated the completeness of the road network in OSM. The differences in OSM data quality are visible also on the regional and local scale, such as the ongoing research about building completeness in cities. That’s why we need better spatial data quality assessment to find out if data is “good enough” in my study area for my purpose. This would promote the adoption and (right) usage of new sources of data such as OSM and data products based on OSM. The ohsome quality analyst (OQT) software computes and provides some of these regional data quality estimations, such as indicators for the currentness and completeness of buildings and roads.
Bringing OSM data quality research into practice and to better understand what is the “purpose” OSM data should be fit for, HOT has defined its 5 Impact areas. This helps us decide what we consider to be the core datasets (and OSM data models) that HOT’s communities and partners use. The impact areas are also the starting points to define a set of “data use cases” that contribute most to HOT’s overall mission and strategy.
-f5c90b.png)
This leads to a set of requirements that indicate when data is suitable to satisfy selected data use cases.Along with identifying metrics and measurements of data quality situated within the three major categories:positional accuracy, completeness, and semantic accuracy. We identified these as part of the first version of the “Data Quality top 10”.
What happens next
A number of activities aiming to improve data quality are already underway. These focus strongly on areas around remote sensing, digitization, and validation via Tasking Manager. We are expanding on these with a wider engagement around data quality aspects via the following:
- Link up potential measurements and metrics to Impact area core datasets.
- With the HOT Regional Hubs, assessing what OSM data insights they need to be able to prioritize and decide on data collection and data quality initiatives.
- Work across HOT’s Data and Tech teams, with input from HeiGIT, to identify the form and shape data quality metrics and insights should take - and how we can go about implementing and publicizing these.
- Consult and discuss with the QA&C working group on their role and capacity in overall data quality planning.
Based on requests from the group that attended, we will be keeping those wanting to learn more about HOT’s roadmap and activities informed in the following ways:
- This blog post, followed by periodic updates (at the minimum quarterly).
- Setting up an OSM wiki page that tracks updates and articles for data quality - both from HOT, but also open to other initiatives.
- Starting an OSM community forum thread for further feedback and ongoing discussion!

